
Abstract
Current genome-wide association studies (GWAS) focusing on relatively common single-nucleotide polymorphisms (SNPs) usually adopt a cost-effective multi-staged design in which a proportion of the total samples are genotyped using a commercial SNP array with a reasonably good coverage of the whole genome at the initial stage, and a list of promising SNPs are further genotyped and evaluated on the remaining samples at the second stage. This staged design in principal can also be used for the study of rare genetic variants at the genome-wide scale, but the statistical methods developed for evaluating the relatively common SNPs under the staged design are not appropriate for rare variants due to the invalidity of large sample theorems. Here, we develop a new statistical framework that aims to evaluate rare variants under two-staged (or multi-staged) design. By extensive computer simulations, we evaluate the empirical type I error rate and power of the proposed procedures. A real example from two recent case–control rheumatoid arthritis genetic association studies is also used to demonstrate the performances of the proposed methods.
Introduction
Current wave of genome-wide association studies (GWAS) focusing on relatively common single-nucleotide polymorphisms (SNPs) (minor allele frequency (MAF)>5%) have successfully identified hundreds of loci associated with risk of various diseases. To date, more than 5900 SNPs have been reported to be associated with different diseases (http://www.genome.gov/gwastudies/). However, some studies have suggested that the genetic variants for common diseases could have a wide spectrum of frequencies, ranging from rare to common, and that rare variants could exhibit a relatively large genetic effect (for example, odds ratio greater than 2).1, 2, 3, 4, 5, 6, 7, 8, 9, 10, 11, 12, 13, 14, 15 For example, in 2008, Stefansson et al.10 found that three rare deletions were associated with schizophrenia with the odds ratios of 2.7, 11.5 and 14.8, respectively. Some authors have proposed novel methods to detect associations with multiple rare variants for common diseases.16, 17, 18, 19, 20
Current GWAS with common SNPs usually adopt a cost-effective staged design in which a proportion of the available sample are genotyped using a commercially available SNP array with a reasonable coverage of the whole genome at the initial stage, and a list of promising SNPs with P-values less than a given threshold are further genotyped on the rest of the samples at the second stage.21, 22, 23, 24 For data analysis, it is generally more powerful to use the joint analysis strategy that combines the statistics from two stages for the final evaluation of the association evidence comparing with the replication-based analysis that only uses the statistic from the second stage.24, 25, 26
In principle, this staged design can be used for future GWAS or candidate gene association studies focusing on rare genetic variants. However, the analysis of rare variant under such a multi-staged design is quite different from that of common variants mainly due to the invalidity of the large sample theorem. It also depends on the type of statistic used for the association test. Here, we focus on the beta test proposed by Li et al.27 and show how to use it for the joint analysis under a two-stage design.
Materials and methods
Beta test
By considering the probabilities of the event that a rare event occurring in Population 1 conditional on that in Population 2, Li et al.27 derived uniform test and beta test, and recommended to use beta test to evaluate the association of single rare variant. Their beta test can be summarized as follows. Assume that a rare event occurs x times among n1 independent trials in Population 1 and y times in n2 independent trials in Population 2. The null hypothesis is that the probability of the rare event occurring in Population 1 is equal to that in Population 2. For common case–control designs, it is assumed that cases group is Population 1 and controls group is Population 2. Then they calculated the conditional probability

where B(·) is a beta function with  . The two-sided P-value for beta test is given by

where I(·) is an indicator function.
The proposed procedure
Assume that there are r cases and s controls randomly drawn from the source population with the proportion of subjects π genotyped in Stage I in a two-stage case–control genetic association study. We assume that cases and controls are sampled from a homogeneous general population in which the Hardy–Weinberg equilibrium holds in control population and no stratification exists. The genotype count for a given biallelic marker (denote two alleles by A and a, and A is the rare or high-risk allele) in both stages are given in Table 1 (collapse the genotype count of AA with that of Aa because the number of individuals in both cases and controls with genotype AA is extremely rare). Let γ be the significance level used to select the SNPs for follow-up and α be the significance level for each SNP at a genome-wide level (γ>α). Let H0 be the null hypothesis that a SNP is not associated with disease, and the corresponding alternative hypothesis be H1 (that is, the negation of H0). Based on the data in Table 1, the conditional probabilities are calculated,

Then P-values of a SNP in both stages are, respectively, equal to

Let’s consider the replication-based analysis first. Denote the threshold of P-values for selecting SNPs to be followed up from Stage I by γ, and the threshold using the beta test in Stage II by b. Then, by controlling the false-positive rate at a chosen α level, we can obtain b according to the following equation

According to the Lemma (the proof of the Lemma takes advantage of Lemma 1 of Li et al.28) in Section A.1 of the Appendix, we have P1  U(0,1) and P2
  U(0,1) as min(r,s) →∞ and r/s
  φ<∞. So b=α/γ. The power is
  . Under a specific alternative hypothesis, we proposed to use the following procedure to calculate the power.
-
1)
Generate B data sets (for example, B=1 × 10⁴) under the alternative hypothesis.
-
2)
For each data set, use beta test to calculate P1 and P2, denote them by P1(1), …, P1(B), and P2(1),…, P2(B), respectively.
-
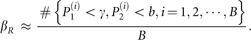
3)
βR can be approximated by

A joint testing statistic can be defined as

Given the type I error level of α and the threshold of P-values in Stage I of γ, the threshold c for the final joint analysis can be chosen to satisfy the following condition

In Section A.2 of the Appendix, we show that c can be solved through the following equation,

Under a specific alternative hypothesis, the power for the joint analysis is given by

We propose to use the following procedure to calculate βJ.
-
1)
Generate B data sets (for example, B=1 × 10⁴) under the alternative hypothesis.
-
2)
For each data set, use beta test to calculate P1 and P2, denote them by P1(1), …, P1(B), and P2(1),…, P2(B), respectively. Then we calculate PJ(1), …, PJ(B), where
 .
. -
3)
βJ can be approximated by

 .
.
Results
In this section, we conduct simulation studies to evaluate the performances of the proposed procedures. We mainly compare type I error rates and power of the replication-based analysis and the joint analysis. We also apply them to a real data set from two independent genetic association studies of rheumatoid arthritis (RA) to demonstrate the advantages of the proposed methods.
Type I error rate
We first validate whether the proposed procedures can maintain the correct type I error rates. Data are generated under the null hypothesis with disease prevalence K=0.1, and the number of cases and controls r = s = 2000. In addition, 0.01 is chosen for γ to be comparable to other studies (for example, Schaid and Sinnwell, 2010).25 Assume that the risk allele is the minor allele, and the MAF is chosen among three levels: 0.005, 0.007 and 0.01. Because of the computation complexity, only the empirical type I error rate at α=0.0001, with π of 0.2, 0.3, 0.4 and 0.5, is evaluated. One million replicates are conducted to calculate the empirical type I error rates. The results (displayed within Table 2) show that both analyses (the replication-based analysis and the joint analysis) can properly control the type I error rate with the empirical values close to the nominal level, 0.0001. For example, when MAF=0.007 and π=0.3, type I error levels of the replication-based analysis and joint analysis are 0.000093 and 0.000098, respectively.
In a GWAS, significance level of 5 × 10⁻⁸ is often used. Because of time limitation, we only consider α=0.0001. As shown in Lemma, the proposed test could keep the type I error rates at significance level of 5 × 10⁻⁸.
Power
Assume there are 1 000 000 SNPs genotyped in a GWAS. The whole genome-wide type I error is 0.05. For each SNP, the significance level is 5 × 10⁻⁸ under the Bonferroni correction. We set γ to be 0.0001, 0.001 and 0.01, and π to be 0.2, 0.3, 0.4 and 0.5. Dominant genetic model with the relative risk 3 is used. Three minor allele frequencies are chosen, 0.005, 0.007 and 0.01. The disease prevalence K is fixed to be 0.1, and 5000 replicates are conducted to calculate the empirical power. The controls are sampled from the general population.
Results of power are summarized in Figure 1. As expected, the joint analysis is more powerful than the replication-based analysis. The power of both analyses increases with increase in the proportion of subjects genotyped in Stage I. The difference in power between both analyses increases as π or γ increases. For example, when MAF=0.007, π=0.3 and γ=0.01, the power difference between both analyses is 0.07, while this difference becomes 0.32 for π=0.5.

Power of a two-stage design for the replication-based analysis (replication) and the joint analysis (joint). Both of the number of cases and controls are equal to 2000. The genome-wide significance level per SNP is 5 × 10⁻⁸ and π is the proportion of subjects genotyped in Stage I. The genotype relative risk for one and two copy risk allele is equal to 3 and the disease prevalence is 0.1. A full color version of this figure is available at the Journal of Human Genetics journal online.
We also evaluate the performances of these two analyses under the situation where there is difference in the rare allele frequency between the samples from two stages. We generate the data similarly but with MAF in Stage I being 0.005 and MAF in Stage II being 0.01. Figure 2 shows the power results. Again, the joint analysis is generally more powerful than the replication-based analysis. We also find that both analyses have the similar performances when π is relatively small (smaller than 0.2) or large (larger than 0.5).

Power for replication-based analysis (replication) and joint analysis (joint) when MAFs in two stages are unequal. The number of cases and controls are equal to 2000. The genome-wide significance level per SNP is 5 × 10⁻⁸ and π is the proportion of subjects genotyped in Stage I. The genotype relative risk for one and two copy risk allele is equal to 3 and the disease prevalence is 0.1. MAFs of Stage I and Stage II are equal to 0.005 and 0.01, respectively. A full color version of this figure is available at the Journal of Human Genetics journal online.
A real data example: rheumatoid arthritis
Rheumatoid arthritis is a chronically autoimmune inflammatory disease that mainly attacks synovial joints. It affects about 1% of the common adult population worldwide.29 MacGregor et al.30 pointed out that the genetic variants might have a major role in RA susceptibility. Several GWAS and candidate gene association studies among US populations and European populations have successfully identified multiple high-risk RA loci.31, 32, 33, 34 Here, we apply the proposed approaches to a rare SNP rs5029937 (major allele G; minor allele T), which displayed a significant association with RA in two independent case–control genetic association studies.32, 34 It is noted that we treat the genotype counts of rs5029937 from Orozco et al.32 (3962 RA cases and 3531 controls) as data in Stage I and those from Stahl et al.34 (5539 RA cases and 20 169 controls) in Stage II. The detailed genotype counts of rs5029937 in RA cases and controls, and P-values under two testing methods are given in Table 3, which suggest that SNP rs5029937 is strongly associated with RA (PReplication=4.49 × 10⁻⁹ and PJoint=9.19 × 10⁻⁹), while the P-values, PTREND=0.001 and PGWAS=7.5 × 10⁻⁸ are reported in Orozco et al.32 and in Stahl et al.,34 respectively. It seems that the proposed testing strategies on the basis of beta test (Li et al.)27 show strong evidences in evaluating rare variants under a two-stage design.
Discussion
Although the GWAS focusing on relatively common SNPs have achieved great successes in identifying loci related to disease susceptibility, mounting evidences have suggested that rare genetic variants could have an important role in the genetic makeup of common human diseases and traits, and some might have a much larger genetic effect than the ones that are typically observed on the relatively common genetic variants. Recent studies suggest that rare genetic variants might contribute to a considerable proportion of the disease heritability.13, 14, 16 With the recent advances in the genomic technologies, it is becoming increasingly feasible to systematically screen both common and rare genetic variants throughout the human genome in search for chromosomal loci underlying the disease susceptibility. With the advance made in the second-generation sequencing technology, it is becoming feasible for investigators to explore the association of rare genetic variants with complex diseases at the genome-wide scale.
A cost-effective multi-staged design is often adopted in the current GWAS focusing on common genetic variants. As for the study of common SNPs, we expect the multi-staged design to be widely used for the genome-wide study of rare genetic variants. However, it requires new statistical procedures as the assumptions made in original methods are not valid for rare variants. Here, we propose a new statistical procedure to evaluate the association between rare variants and disease outcomes under the multi-staged design. We conducted extensive simulation studies to validate the performances of the proposed method, and demonstrate that it is generally more efficient to combine data from all stages (the joint test) rather than to rely on the second-stage data only (the replication-based test), a conclusion similar to the one well known for the study of common SNPs in Skol et al. (2006).24
We also conduct simulation studies to compare the joint/replication-based analysis based on beta test with those based on Fisher’s exact test. Results not shown here indicate that joint/replication-based analysis based on beta test is more powerful than those based on Fisher’s exact test.
We also evaluated the performance of the proposed methods under the situation where the odds ratios for the disease-associated SNPs are different between the two populations from which the stage one and stage two samples are collected. Our simulation studies not indicated here show that the joint analysis, in general, is more powerful than the replication-based analysis under this situation. So, we recommend using the joint test to evaluate rare variants as an alternatively single-marker testing strategy in future two-staged GWAS or candidate gene association studies for rare variants.
We implement the proposed procedures using R version 2.13.2. R codes are freely requested from the first author.
References
Pritchard, J. K. Are rare variants responsible for susceptibility to complex diseases? Am. J. Hum. Genet. 69, 124–137 (2001).
Cohen, J. C., Kiss, R. S., Pertsemlidis, A., Marcel, Y. L., McPherson, R. & Hobbs, H. H. Multiple rare alleles contribute to low plasma levels of HDL cholesterol. Science 305, 869–872 (2004).
Fearnhead, N. S., Wilding, J. L., Winney, B., Tonks, S., Bartlett, S., Bicknell, D. C. et al Multiple rare variants in different genes account for multifactorial inherited susceptibility to colorectal adenomas. Proc. Natl Acad. Sci. USA 101, 15992–15997 (2004).
Cohen, J. C., Pertsemlidis, A., Fahmi, S., Esmail, S., Vega, G. L., Grundy, S. M. et al Multiple rare variants in NPC1L1 associated with reduced sterol absorption and plasma low-density lipoprotein levels. Proc. Natl Acad. Sci. USA 103, 1810–1815 (2006).
Kryukov, G. V., Pennacchio, L. A. & Sunyaev, S. R. Most rare missense alleles are deleterious in humans: implications for complex disease and association studies. Am. J. Hum. Genet. 80, 727–739 (2007).
Azzopardi, D., Dallosso, A. R., Eliason, K., Hendrickson, B. C., Jones, N., Rawstorne, E. et al Multiple rare nonsynonymous variants in the adenomatous polyposis coli gene predispose to colorectal adenomas. Cancer Res. 68, 358–363 (2008).
Gorlov, I. P., Gorlova, O. Y., Sunyaev, S. R., Spitz, M. R. & Amos, C. I. Shifting paradigm of association studies: value of rare single-nucleotide polymorphisms. Am. J. Hum. Genet. 82, 100–112 (2008).
Ji, W., Foo, J. N., O’Roak, B. J., Zhao, H., Larson, M. G., Simon, D. B. et al Rare independent mutations in renal salt handing genes contribute to blood pressure variation. Nat. Genet. 40, 592–599 (2008).
Slatter, T. L., Jones, G. T., Williams, M. J., Van Rij, A. M. & McCormick, S. P. Novel rare mutations and promoter haplotypes in ABCA1 contribute to low-HDL-C levels. Clin. Genet. 73, 179–184 (2008).
Stefansson, H., Rujescu, D., Cichon, S., Pietiläinen, O. P., Ingason, A., Steinberg, S. et al Large recurrent microdeletions associated with schizophrenia. Nature 455, 232–236 (2008).
Walsh, T., McClellan, J. M., McCarthy, S. E., Addington, A. M., Pierce, S. B., Cooper, G. M. et al Rare structural variants disrupt multiple genes in neurodevelopmental pathways in schizophrenia. Science 320, 539–543 (2008).
Nejentsev, S., Walker, N., Riches, D., Egholm, M. & Todd, J. A. Rare variants of IFIH1, a gene implicated in antiviral responses, protect against type 1 diabetes. Science 324, 387–389 (2009).
Cirulli, E. T. & Goldstein, D. B. Uncovering the roles of rare variants in common disease through whole-genome sequencing. Nat. Rev. Genet. 11, 415–425 (2010).
Dickson, S. P., Wang, K., Krantz, I., Hakonarson, H. & Goldstein, D. B. Rare variants create synthetic genome-wide associations. PLoS Biol. 8, e1000294 (2010).
Mitsui, J., Fukuda, Y., Azuma, K., Tozaki, H., Ishiura, H., Takahashi, Y. et al Multiplexed resequencing analysis to identify rare variants in pooled DNA with barcode indexing using next-generation sequencer. J. Hum. Genet. 55, 448–455 (2010).
Li, B. & Leal, S. M. Methods for detecting associations with rare variants for common disease: application to analysis of sequence data. Am. J. Hum. Genet. 83, 311–321 (2008).
Li, B. & Leal, S. M. Discovery of rare variants via sequencing: implications for the design of complex trait association studies. PLoS Genet. Genetics 5, e1000481 (2009).
Price, A. L., Kryukov, G. V., de Bakker, P. I., Purcell, S. M., Staples, J., Wei, L. J. et al Pooled association tests for rare variants in exon-resequencing studies. Am. J. Hum. Genet. 86, 832–838 (2010).
Morris, A. P. & Zeggini, E. An evaluation of statistical approaches to rare variant analysis in genetic association studies. Genet. Epidemiol. 34, 188–193 (2010).
Ionita-Laza, I., Buxbaum, J. D., Laird, N. M. & Lang, C. A new testing strategy to identify rare variants with either risk or protective effect on disease. PLoS Genet. 7, e1001289 (2011).
Satagopan, J. M. & Elston, R. C. Optimal two-stage genotyping in population-based association studies. Genet. Epidemiol. 25, 149–157 (2003).
Satagopan, J. M., Venkatraman, E. S. & Begg, C. B. Two-stage designs for gene-disease association studies with sample size constraints. Biometrics 60, 589–597 (2004).
Thomas, D., Xie, R. & Gebregziabher, M. Two-stage sampling designs for gene association studies. Genet. Epidemiol. 27, 401–414 (2004).
Skol, A. D., Scott, L. J., Abecasis, G. R. & Boehnke, M. Joint analysis is more efficient than replication-based analysis for two-stage genome-wide association studies. Nat. Genet. 38, 209–213 (2006).
Schaid, D. J. & Sinnwell, J. P. Two-stage case-control designs for rare genetic variants. Hum. Genet. 127, 659–668 (2010).
Pan, D., Li, Q., Jiang, N., Liu, A. & Yu, K. Robust joint analysis allowing for model uncertainty in two-stage genetic association studies. BMC Bioinformatics 12, 9 (2011).
Li, Q., Zhang, H. & Yu, K. Approaches for evaluating rare polymorphisms in genetic association studies. Hum. Hered. 69, 219–228 (2010).
Li, Q., Li, G. & Xiong, S. Assessment of cell number for a multinomial distribution with application to genomic data. Metrika 71, 151–164 (2010).
Silman, A. J. & Pearson, J. E. Epidemiology and genetics of rheumatoid arthritis. Arthritis Res. Ther. 4 ((Suppl 3)) S265–S272 (2002).
MacGregor, A. J., Snieder, H., Rigby, A. S., Koskenvuo, M., Kaprio, J., Aho, K. et al Characterizing the quantitative genetic contribution to rheumatoid arthritis using data from twins. Arthritis Rheum. 43, 30–37 (2000).
Raychaudhuri, S., Remmers, E. F., Lee, A. T., Hackett, R., Guiducci, C., Burtt, N. P. et al Common variants at CD40 and other loci confer risk of rheumatoid arthritis. Nat. Genet. 40, 1216–1223 (2008).
Orozco, G., Hinks, A., Eyre, S., Ke, X., Gibbons, L. J., Bowes, J. et al Combined effects of three independent SNPs greatly increase the risk estimate for RA at 6q23. Hum. Mol. Genet. 18, 2693–2699 (2009).
Bowes, J., Lawrence, R., Eyre, S., Panoutsopoulou, K., Orozco, G., Elliott, K. S. et al Rare variation at the TNFAIP3 locus and susceptibility to rheumatoid arthritis. Hum. Genet. 128, 627–633 (2010).
Stahl, E. A., Raychaudhuri, S., Remmers, E. F., Xie, G., Eyre, S., Thomson, B. P. et al Genome-wide association study meta-analysis identifies seven new rheumatoid arthritis loci. Nat. Genet. 42, 508–514 (2010).
Acknowledgements
We would like to thank two anonymous referees for their insightful comments. This work was partially supported by the National Science Foundation of China (10901155, 61134013 to Q.L.).
Author information
Authors and Affiliations
Corresponding author
Appendix
Appendix
A.1 Lemma
Suppose that X follows a binomial distribution with parameters n and θ. Then for any given α∈(0,1),

Proof. For  define

Let  . Define
  .
.
According to Lemma 1 of Li, Li, & Xiong (2010),28  So, V(kα,1)=α−o(1), and v(kα,2)=α−o(1). We now consider two cases:
(1) When  ,
,

(2) When  , in the similar way, we have the results.
A.2 Derivation of the Threshold for the Joint Testing Statistic
To controll the type I error rate of the joint analysis, we have

Based on the Lemma above, when min(r,s) →∞ and r/s  , we can get
  means ‘convergence in distribution’ and U(0,1) is the standard uniform distribution. Now, we calculate the threshold c from the above equation under the following two scenarios:
(1) When  . Then X and Y are independent with the probability density functions
  , respectively. So the joint probability density function of (X,Y)′ is

Then, we calculate

Therefore g(c) is a strictly increasing function on the interval  . Then the equation g(c)=α has a unique solution of c on
  because of g(−∞)=0 and
  . So, we can use the Bi-section Method to get c.
(2) When π=0.5,

As  , no solution exists.
And when  , we have

so the threshold c is the solution of the equation  . Let
. Let  . Note that
  . So, h(c) is strictly increasing as
  . As
. As  , h(−∞)=0,
  has a unique solution on
  .
.
Rights and permissions
About this article
Cite this article
Li, Q., Pan, D., Yue, W. et al. Evaluating rare variants under two-stage design. J Hum Genet 57, 352–357 (2012). https://doi.org/10.1038/jhg.2012.33
Received:
Revised:
Accepted:
Published:
Issue Date:
DOI: https://doi.org/10.1038/jhg.2012.33
