
Abstract
Recently, it has become possible to directly detect changes in neuropeptide vesicle dynamics in nerve terminals in vivo and to measure the release of neuropeptides induced experimentally or evoked by normal behavior. These results were obtained with the use of transgenic fruit flies that express a neuropeptide tagged with green fluorescent protein. Here, we describe how vesicle movement and neuropeptide release can be studied in the larval Drosophila neuromuscular junction using fluorescence microscopy. Analysis methods are described for quantifying movement based on time lapse and fluorescence recovery after photobleaching data. Specific approaches that can be applied to nerve terminals include single particle tracking, correlation and Fourier analysis. Utilization of these methods led to the first detection of vesicle mobilization in nerve terminals and the discoveries of activity-dependent capture of transiting vesicles and post-tetanic potentiation of neuropeptide release. Overall, this protocol can be carried out in an hour with ready Drosophila.
Introduction
This protocol is focused on using optics to study neuropeptide release and peptidergic vesicle mobility in vivo. We developed these methods for four reasons. First, neuropeptides regulate behavior, mood and development and so are essential for operation of the nervous system. Second, like fast synaptic transmission, neuropeptide release occurs at nerve terminals in response to electrical activity. Thus, general neurotransmission mechanisms can be discerned from studies of neuropeptide release. Third, neuropeptides are synthesized in the neuronal cell body (also called the soma) and transported to nerve terminals. Because this is true for all proteins involved in neurotransmission, studying neuropeptide vesicles can reveal insights into how synapses maintain function and undergo plasticity despite being very far from the cell body. Finally, movement and release of single large dense core vesicles can be resolved in nerve terminals in vivo because green fluorescent protein (GFP)-tagged neuropeptides are highly concentrated in these organelles. In contrast, this has not been possible for small synaptic vesicles. Here, we present methods for studying neuropeptide vesicle exocytosis and motion in the Drosophila larval neuromuscular junction (NMJ). Our goal is to explain for novice fly researchers and Drosophila experts with limited quantitative imaging experience how to perform and analyze results from in vivo optical experiments.
The experimental preparation
A key advantage of working with fruit flies is that thousands of lines are readily available from stock centers (see Flybase (http://www.flybase.net)) for a nominal fee, as well as from individual laboratories. We have worked extensively with flies that express emerald GFP-tagged ANF (atrial natriuretic factor) under the control of a promoter that is sensitive to the yeast transcription factor GAL4, and a newer line that expresses ANF tagged with Topaz fluorescent protein1,2,3,4. By crossing such flies with other lines that express GAL4, expression of the GFP-tagged neuropeptide/hormone can be induced. Even though there is no ANF homolog in Drosophila, evolutionarily conserved sequences lead to packaging into secretory vesicles in fly neurons1 and behaviorally evoked release that is comparable to native peptides5,6 (but see ref. 7 for a developmental effect). Neuropeptides are not taken up by endocytosis unless a specific receptor is present to mediate such transport. Thus, the use of peptide that is not present in the fly genome ensures that changes in the GFP-tagged neuropeptide content of a nerve terminal arise only from vesicle transport and exocytosis.
For the novice, maintaining such flies is a simple matter that is facilitated by the availability of commercial sources for all needed supplies (e.g., vials, pre-made fly food) such as Applied Scientific (distributed by Fisher) and Carolina Biological Supply. Likewise, the Flybase website and numerous methods books8,9 provide basic information on maintaining flies and preparing the filleted 3rd instar larval preparation we use to image the NMJ.
In general, we have adopted approaches developed for studying fast transmission at the larval NMJ. For example, we take a number of precautions to minimize muscle contractions, which disrupt imaging of the live NMJ (see PROCEDURE, Step 2). However, we do not cut motor nerves. Although this prevents central activation of motor neuron terminals and facilitates nerve stimulation via a suction electrode, we found that cutting the motor neuron axons compromises synaptic neuropeptide release. Therefore, we leave motor nerves intact in all of our experiments, and brain-triggered motoneuron activity is inhibited by cutting the ventral ganglion to prevent communication between motoneurons and the central pattern generator responsible for driving larval translocation10. Also, we often use the high-Mg/Ca saline HL3 to reduce spontaneous activity2,3,4.
Stimulation
A loop of motor nerve can still be stimulated electrically via a suction electrode. Alternatively, nerve terminals can be stimulated by application of high-potassium salines2,3,4. However, as this induces global depolarization, muscle contraction is also induced. Thus, in contrast to electrical stimulation, release and vesicle mobilization are not typically imaged during the depolarization induced by bath potassium. Instead, the medium can be replaced (e.g., with a zero-calcium, normal potassium saline) and imaging resumed after muscle contractions have subsided. The high magnesium content of HL3 is an advantage for minimizing muscle contractions, but also inhibits the calcium influx that triggers exocytosis. Thus, for experiments in which maximal release is desired, standard saline is used2,3,4.
Acquisition of GFP-tagged peptide data
The simplest instrument for optically measuring neuropeptide release and vesicle movement is the standard epifluorescence wide-field microscope. Light gathering is efficient because light is not discarded, which differs from the confocal microscope. However, both in focus and out of focus light is collected. Fortunately, out of focus light is fairly minimal in the larval NMJ. Thus, we have used wide-field microscopy for most of our measurements of neuropeptide release and peptidergic vesicle mobilization and transiting.
The single most important component of a fluorescence imaging setup is the microscope objective. Although one might assume that magnification (M or power) is important, numerical aperture (NA) of an objective is more important. NA determines the capacity to concentrate illumination light, which is proportional to NA2, the capacity to gather emitted light (also proportional to NA2) and the resolution of the image (λ/2NA transverse, 2λη/NA2 axial, where λ is the wavelength of emitted light and η is the refractive index of the medium). Therefore, the overall fluorescence signal is a strong function of NA (i.e., proportional to NA4/M2), and the brightness of point-like features (e.g., the image of a single vesicle) is yet stronger (i.e., being proportional to NA6/M2) (ref. 11). The filleted larval preparation can only be viewed from above with an upright microscope. Hence, it is most important to use the highest NA direct water immersion ('dipping') objective possible.
Because the imaging device discretely samples the image field, a key parameter is the magnification of the microscope image on the camera chip. Release measurements, in which the neuropeptide content of a terminal is followed with little interest in vesicle movement, do not require high spatial resolution. Under these circumstances, less magnification, larger pixels or combined binned pixels are desirable because noise in the intensity measurement is minimized. However, to resolve individual vesicles, the Nyquist criterion should be satisfied: the sample interval (pixel spacing) should be one-half of Abbe's resolution limit (pixel width should be Mλ/4(NA), where M is the magnification of the system in the plane of the camera)11. If pixels are smaller than given by the above equation, one is oversampling. This produces more noise with no gain in real information. Of course, the pixel size on the camera chip may not be optimal for the magnification and NA of a given objective. However, such mismatches can be corrected with magnifier changer attachments for the microscope.
Another important parameter is the intensity of illumination. This has to be adjusted to yield a maximal signal without photobleaching the chromophore (ANF-GFP in our case). Typically, we attenuate the light from arc lamps with the use of neutral density filters or the aperture diaphragm of the epifluorescence adapter. Of course, photobleaching accumulates with repetitive bouts of illumination and so the number of images required for a given experiment impacts on the chosen illumination intensity. Finally, it is also important to use a regular schedule of illumination during an experiment (i.e., do not vary the period between exposures) as some fluorescent proteins show complex time dependence owing to blinking behavior and reversible photobleaching12.
Analysis of fluorescent vesicle data: measuring release and mobility in nerve terminals
Although one can easily watch movies generated from imaging data, the psychology of human vision affects the subjective interpretation of such data. Thus, the only way to accurately analyze GFP-labeled vesicle data is to transform pictures into numbers so that objective statistical criteria can form the basis for conclusions. We typically transform our images into a standard format (e.g., TIFF (tagged image file format)) and then use the public-domain program ImageJ (see http://rsb.info.nih.gov/ij/) to analyze our experimental results. ImageJ contains many useful tools and plug-ins to facilitate this effort. For example, one problem with studying the NMJ is that a minor muscle twitch can lead to a shift in the image. ImageJ includes subroutines to register the images so that such horizontal displacements are removed. Registration cannot correct for vertical movements and so only in-focus images can be used for quantification. Typically, we measure the fluorescence in a bouton and use a region without GFP-neuropeptide for background subtraction. By repeating this procedure, it is possible to assay peptide release as the percentage drop in fluorescence following stimulation.
If one is fortuitous enough to be able to detect and follow individual vesicles, single particle tracking can be used to determine vesicle trajectories and flux (i.e., the number of vesicles passing through a region per unit time). Although the diffraction limit affects the apparent size of a vesicle image, precision in determining the position of the center of the vesicle image, which occupies many pixels, is only limited by image signal-to-noise ratio: generally, the width of the diffraction-limited vesicle image divided by the square root of the number of photocounts in that image feature. Thus, from a series of images, the trajectory of a vesicle can be determined and its velocity can be measured. It is informative to plot d2 versus time, where d is the distance from a point of origin. If such a plot is linear, then the motion of the vesicle conforms to the diffusion equation (i.e., it appears to be by a random walk). On the other hand, a plot with positive curvature is consistent with motor-mediated motion on a linear cytoskeletal track, whereas a curve that plateaus can be indicative of motion within a cage.
Often there are too many vesicles in a nerve terminal to resolve for single particle tracking. Under such circumstances, the fraction of vesicles that are mobile and the diffusion coefficient for those vesicles can be measured by fluorescence recovery after photobleaching (FRAP, also known as fluorescence photobleaching recovery or FPR). We have used the scanning laser of a confocal microscope to photobleach GFP-tagged neuropeptidergic large dense core vesicles, small synaptic vesicles, potassium channels and a G protein2,13,14,15,16. The basis of the method is that if a region is photobleached and the target (e.g., neuropeptide vesicles) is mobile, then the fluorescence in the photobleached region should recover as fluorescent vesicles from surrounding unbleached areas diffuse to replace their photobleached companions. The speed of recovery depends upon the diffusion coefficient (D) of the tagged objects and the width or diameter of the photobleached pattern. The basic relation for FRAP in a diffusing system is D = γr02/τ, where r0 is the pattern width, τ is the observed recovery time constant and γ is a geometry-dependent numerical factor. The mathematical form of the recovery curve also depends upon the geometry of the pattern, such as the steepness of the initial tracer gradient. The geometrical factors are important because they affect the path that unbleached vesicles must traverse during FRAP and because recovery depends on the gradient in fluorescence between the bleached and unbleached regions. Therefore, to determine the diffusion coefficient of vesicles, it is crucial to take these geometrical considerations into account. However, the fold change in the diffusion coefficient with a stimulus is always inversely proportional to the fold change in the half-life of FRAP. Thus, it is easy to measure relative changes in vesicle diffusion directly from FRAP data. Also, the limited extent of FRAP (i.e., a recovery less than 100%) can also be determined directly from data after correction for tracer dilution in finite compartments, giving the fraction of mobile vesicles. In principle, a biological stimulus could affect both the diffusion coefficient and mobile fraction of secretory vesicles.
There are a variety of approaches for determining diffusion coefficients from FRAP data. For example, fluorescence can be quantified in regions that were either photobleached or that contained fluorescent vesicles far from the photobleached region. A ratio can then be calculated between the intensity in these regions. This ratio will not be affected by photobleaching that occurs while gathering recovery data (i.e., during the period when many images are acquired with moderate levels of illumination). The half time of recovery can then be used to calculate the diffusion coefficient after one takes into account the shape of the photobleached region (e.g., whether the bleached region was a circle or a line) and the bleach depth and profile. Traditionally, this was performed by formulating a geometry-specific mathematical model for fitting FRAP data. However, an alternative general approach to FRAP analysis of diffusion systems, such as movement of synaptic vesicles in nerve terminals16, can be made through the use of the image Fourier transform17 without any explicit modeling. Because bleaching is usually carried out with sufficient depth of focus, recovery from above and below the plane of focus is insignificant and thus can be considered two-dimensional with either method.
The basis of the Fourier method derives from the fact that a pure sinusoidal concentration pattern relaxes as a pure exponential under diffusive transport: c(x,t) = c0 sin(kx) exp(−Dk2t), where k is the spatial frequency of the pattern in radians per unit length (k = 2π/L, where L is the spatial period), D is the diffusion coefficient and t is time. As the Fourier transform decomposes a signal or image into a spatial frequency spectrum of pure sine and cosine waves, the decay of individual Fourier components in a time-lapse image sequence after photobleaching should be exponential, with rate proportional to D. The k2 dependence causes high-frequency components to decay much faster than low-frequency components.
Photobleaching and single particle tracking can also be combined. Indeed, this led to the discovery that neuropeptide vesicles transit through synaptic boutons (see Supplementary Video 1 online)3. In those experiments, whole boutons were photobleached to nearly eliminate the signal from the ∼260 resident vesicles in a bouton. With a lower background, it then became possible to follow individual vesicles as they arrived at and left boutons. Analysis of this vesicle flux revealed that the rebound in peptide content following release was caused by capture from a pool of vesicles that had been transiting through the terminal before stimulation.
Image correlation measurements offer a third strategy for quantifying changes in vesicle mobility. In its simplest form, pixel-by-pixel correlation coefficients (CCs) are determined between sequential registered images obtained in a time-lapse series. Such CCs can be calculated in many software packages including ImageJ. If there is no vesicle motion and there is little noise, then a CC near 1 will be obtained because the images will be identical. However, the CC will change with vesicle mobilization. More intensive analysis called image correlation spectroscopy uses the time dependence of the CC to calculate diffusion coefficients. However, this methodology requires favorable optics and geometry for a rigorous treatment. In vivo vesicle mobilization in Drosophila boutons detected with wide-field microscopy (see Supplementary Videos 2 and 3 online) is not ideally suited for the latter approach. Therefore, changes in the CC have been used to quantify mobilization. This approach is advantageous because it is unbiased and quantitative. However, the change in vesicle motion cannot be quantified on a linear calibrated scale. Also, the sensitivity of the signal drops with increasing number of vesicles; therefore, FRAP may be better suited for boutons with >1,000 vesicles. Nevertheless, this assay served as the basis for discovering that vesicle mobilization lasts for minutes following seconds of activity2 and is currently being used to determine the signaling underlying this synaptic effect.
Here, we first describe how to stimulate the Drosophila NMJ and then how to monitor release and vesicle mobilization using FRAP and correlation analysis.
Background information about the model system
We have worked most extensively with flies that express GAL4 driven by pan-neuronal (elav-GAL4) and peptidergic cell-specific promoters (386-GAL4). For release studies, it is sufficient to cross either of the above lines with UAS-ANF::EMD (Bloomington stock 7001). However, these progeny will be heterozygous for both the GAL4 driver and the GFP-tagged peptide gene. Stronger fluorescence signals are evident in homozygous animals (see Table 1), which can be obtained from the corresponding author. These flies can be grown on a variety of media, but for convenience, we use a prepared food (Jazzmix). Wandering third instar larvae are dissected and filleted8. This is carried out in zero-calcium saline to ensure that the dissected animal is paralyzed. The ventral ganglion is then cut to disconnect input from central pattern generators to the intact motor neurons10. For electrical stimulation, the bathing solution is replaced with a calcium-containing solution (e.g., HL3). However, muscle contractions are minimized by stretching the animals out with movable magnetic pins8 and inclusion of chemicals in calcium-containing saline to desensitize (10 mM glutamate) or block (100 μM 1-naphthylacetyl spermine trihydrochloride) postsynaptic glutamate receptors.
Materials
Reagents
-
Drosophila
-
Calcium chloride (Sigma-Aldrich)
-
EGTA (Sigma-Aldrich)
-
Hemisodium HEPES (Sigma-Aldrich)
-
Jazzmix Drosophila food (Applied Scientific, Fisher)
-
Magnesium chloride (Sigma-Aldrich)
-
1-Naphthylacetyl spermine trihydrochloride (Sigma-Aldrich)
-
Potassium chloride (Sigma-Aldrich)
-
Sodium bicarbonate (Sigma-Aldrich)
-
Sodium chloride (Sigma-Aldrich)
-
Sodium glutamate (Sigma-Aldrich)
-
Sucrose (Sigma-Aldrich)
-
Trehalose (Sigma-Aldrich)
-
1.5 mM borosilicate filament glass and patch pipette holder with a side port (World Precision Instruments or Warner Instruments)
Equipment
-
For dissection: stereomicroscope equipped with fiberoptic illuminator, forceps and iridectomy scissors
-
Imaging chamber and magnetic pins
-
For wide-field imaging: upright epifluorescence microscope equipped with a low-NA and low-magnification (e.g., ×4) air objective, high-NA direct water immersion dipping objective (e.g., 0.9–1.1 NA ×60), electronic shutter and cooled CCD camera
-
For FRAP: scanning laser confocal microscope
-
For electrical stimulation: stimulator, manipulator, patch pipette holder with side port and silver/silver chloride wire, ground silver/silver chloride wire and patch pipette puller
-
For analysis: computer with ImageJ 1.37v or later version
Reagent Setup
-
HL3 solution 70 mM NaCl, 5 mM KCl, 1.5 mM CaCl2, 20 mM MgCl2, 10 mM NaHCO3, 5 mM trehalose, 115 mM sucrose, 5 mM sodium HEPES, pH 7.2
-
Zero-calcium HL3 Same as HL3 except substitute CaCl2 with 0.5 mM EGTA from a pH 9 NaEGTA stock.
-
High-potassium HL3 Same as HL3 except replace KCl with NaCl.
-
Standard saline 128 mM NaCl, 2 mM KCl, 1.8 mM CaCl2, 4 MgCl2, 35.5 mM sucrose, 5 mM sodium HEPES, pH 7.2.
-
High-potassium standard saline Same as standard saline except replace 85 mM NaCl with KCl.
-
Jazzmix Prepare according to the manufacturer's instructions.
Equipment setup
-
Imaging chamber We fabricated an imaging chamber (Fig. 1) by punching a hole in adhesive business card magnets, attaching the magnets to a 75 mm ×50 mm glass slide and sealing the edges with silicone glue. Insect pins (Carolina Biological) were epoxied onto magnetic steel washers. The advantage of this chamber is that a larva can be filleted, pinned down and then stretched by sliding the pins. This facilitates viewing the preparation and ensures that the NMJ movement is minimized.
Figure 1: The filleted larval NMJ in an imaging chamber. 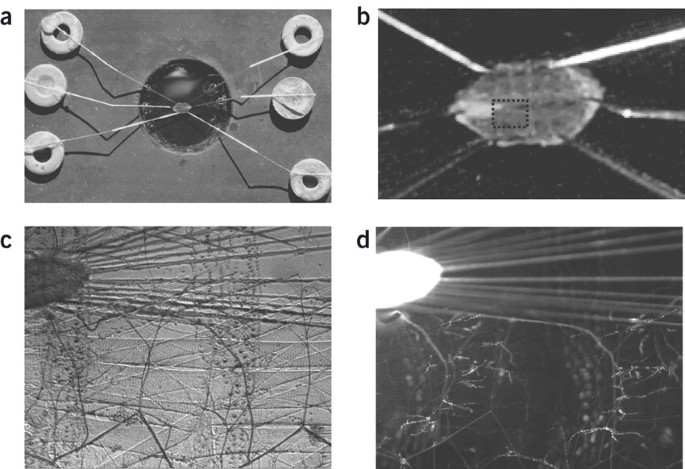
(a) The imaging chamber viewed from above with a pinned out filleted third instar larva. (b) Close-up of the filleted larva. Note that after dissecting on the dorsal midline and removing the intestinal tract, pins are used to stretch the preparation out. (c) Bright-field view through × 10 objective showing the tip of ventral ganglion, motor nerves and two segments with longitudinal muscles. (d) Epifluorescence view of c showing GFP-neuropeptide signal. As a pan-neuronal driver was used, the ventral ganglion and nerves produce a strong signal. Motor neuron terminals on the longitudinal muscles with multiple boutons are also brightly labeled.
-
Electrical stimulator For electrical stimulation, mount a simple manipulator on a rail attached close to or on the microscope stage. Use a standard side port patch clamp pipette holder with a Ag/AgCl wire for mounting the electrode. Using a low-power objective (e.g., ×4), suck a loop of nerve into the stimulation pipette. Then move the stage to view nerve terminals without disturbing the motor nerve. Place the ground electrode in the bath.
-
Data collection Use high-NA objectives for viewing the NMJ. Collect data with a cooled CCD camera with a computer-controlled shutter to ensure a regular schedule of illumination with minimal photobleaching. Ideally, one would like to use the most sensitive, fastest and lowest noise camera available. Of course, these parameters depend on price. Currently, useful cameras cost anywhere from $6,000–40,000. An important point in coupling the camera to the microscope is to make sure that magnification and pixel size on the CCD camera chip are matched so that one can acquire data at the necessary level of resolution. For example, we add an additional ×1.2 magnification when we use a ×60 1.1 NA objective along with a camera having 7.5 μm CCD pixel elements.

Procedure
The larval NMJ preparation
-
1
Obtain appropriate flies: for release studies, it is sufficient to cross either flies that express GAL4 driven by pan-neuronal (elav-GAL4) or peptidergic cell-specific promoters (386-GAL4) with UAS-ANF::EMD (Bloomington stock 7001). However, these progeny will be heterozygous for both the GAL4 driver and the GFP-tagged peptide gene. Stronger fluorescence signals are evident in homozygous animals, which are freely available (e.g., from the corresponding author). Grow flies on appropriate media; for convenience we use a prepared food (Jazzmix).
-
2
Dissect and fillet wandering third instar larvae8. First place the animal in zero-calcium saline to ensure that the dissected animal is paralyzed. Place pins on the head and tail of the animal and then use iridectomy scissors to cut along the dorsal midline and laterally so that the animal's body wall can be pinned out to form a flat sheet (see Fig. 1). Dissect out intestinal tract and then cut the ventral ganglion to disconnect input from central pattern generators to the intact motor neurons10. Slide the pins to stretch the animals out to minimize muscle contractions.
-
3
If performing electrical stimulation, replace the zero-calcium saline from Step 2 with a calcium-containing solution (e.g., HL3) supplemented with chemicals to desensitize (10 mM glutamate) or block (100 μM 1-naphthylacetyl spermine trihydrochloride) postsynaptic glutamate receptors.
-
4
Construct suction electrodes. We construct suction electrodes from micropipette glass. Filament glass is used to ease back filling of the pipette. With a patch pipette puller, it is possible to fabricate an electrode with a 5–10 μm tip. Alternatively, the tip of a smaller pipette can be broken to yield an opening in this size range. The goal is to fabricate a pipette so that a loop of motor nerve can be sucked by mild mouth suction to fit into the tip snugly. This ensures that stimulation via a silver/silver chloride wire in a standard patch pipette holder efficiently induces excitation of motoneuron axons. Because the suction electrode can be reused for multiple experiments, this step is required only occasionally.
-
5
Stimulate motor nerves with voltage pulses. Typically, duration for each pulse is set to 0.5 ms and the voltage is varied to find the threshold for evoking a muscle contraction following a single stimulus. The voltage is then set at double the threshold and the stimulator is set so that it can produce a burst (e.g., 70 Hz for 15 s) of stimulation during the experiment. This stimulation paradigm is sufficient for evoking release for 2 min. For longer periods of secretion, repetitive bursting stimulation is effective (e.g., 15 s of 70 Hz stimulation followed by 15 s of no stimulation, repeat). An alternative approach that is technically easier is to bath apply high-potassium HL3.
Data acquisition
-
6
Typically, acquire images with exposure times of 80–200 ms every 3 s. However, the appropriate number of images to acquire varies with the experimental design. For example, release measurements may only require a few images to establish a constant baseline before stimulation and another comparable set shortly after stimulation. However, to image the rebound in peptide content owing to capture of transiting vesicles, which peaks 5–10 min after stimulation, much longer time courses are required. Either images have to be acquired at greater intervals or in greater number. Mobility measurements using correlation-based approaches (see below) by necessity also require many images for each measurement. Thus, the experimental design determines the required number of images. Obviously, greater image acquisition is accompanied with more photobleaching, which is reflected in an irreversible downward drift in fluorescence. Hence, the level of illumination, as well as magnification and binning settings, should be adjusted differently for release and vesicle mobility measurements.
Confocal photobleaching
-
7
To conduct FRAP measurements, a photobleach step must be inserted into the experiment. Depending on the experimental design, this can be performed either before or after stimulation. Two types of protocols can be used to photobleach a stripe. First, for the thinnest possible photobleach profile, repeat a line scan. Alternatively, a rectangular profile can be used. In either case, use maximal power of the 488 nm argon laser line. We typically photobleach until the fluorescence in the target region is reduced by ∼70%. This seems to be sufficient for obtaining a large dynamic range without inducing photodamage. Once the bleaching is complete, resume data acquisition with a wide-field microscope and the CCD camera. As a control, repeat the photobleach. If the time course and extent of FRAP are similar, photodamage was not likely to be significant. However, if the second FRAP response is different, it is possible that photodamage occurred and so the bleach intensity should be decremented. To verify that conventional and “reversible” photobleaching12 are not problematic, the preparation can be fixed with 4% (w/v) paraformaldehyde in phosphate-buffered saline. This induces crosslinking to prevent vesicle movement. Thus, there should be no FRAP after fixation. As an alternative approach, the confocal laser can be used to photobleach and acquire recovery data. However, detection with a CCD camera by wide-field microscopy can be more sensitive. Indeed, the latter approach was used to detect transiting vesicles because of the limited sensitivity of an old scanning confocal microscope. However, transiting vesicles are readily detected after photobleaching with some newer models (e.g., Olympus Fluoview 1000).
-
8
Continue to acquire images following photobleaching.
Data analysis
-
9
Save images in TIFF format and import into ImageJ using the File, Open command.
-
10
Combine separate images from a single experiment to make a stack: Click on Image, Stack and then Convert Images to Stack. This ensures that any command applied to the first image will be repeated for all the images in a stack. If there is horizontal movement of the NMJ, this can be corrected with registration using the Rigid Body option of the Stackreg plugin, which requires installation of the Turboreg plugin.
-
11
For release measurements, measure peptide fluorescence in a region of interest (ROI) such as a synaptic bouton. This is performed by clicking on a shape icon and drawing the ROI. Then click Analyze, set measurement to Intensity and then click Measure. These results can then be copied and pasted into a spreadsheet program (e.g., Excel). Drag the shape to a different area for background measurements. Subtract these values from the values of the original ROI to determine the change in intensity, which reflects peptide content.
Fourier analysis of FRAP data for single stripe photobleaching
-
12
Perform Fourier analysis of FRAP data in ImageJ with the following steps (see Fig. 2). First, select square 2n × 2n FRAP subimages (ROIs) and a pre-bleach image (i.e., the number of pixels on each side of the square ROI must be a power of 2 such as 64, 128, 256 or 512).
Figure 2: Estimation of a diffusion coefficient by Fourier analysis of FRAP images. 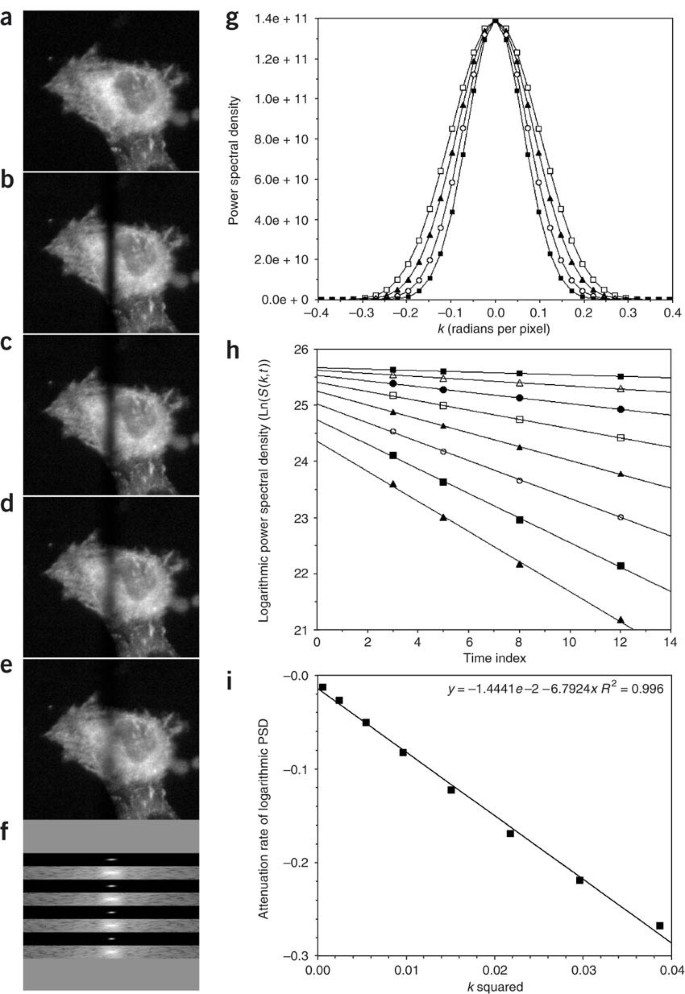
In the simulation shown, a 5.8 μm stripe was imprinted at t = 0 on a cell containing the fluorescent tracer. (a) Pre-bleach image. (b–e) FRAP images at t = 3, 5, 8 and 12 seconds, respectively. From (b) to (e), the FRAP images show progressive blurring of the pattern due to diffusion. Each image is 256 × 256 pixels square to enable use of a two-dimensional FFT, which operates on 2n × 2n image data. To isolate the part of each image that changes owing to diffusion, difference images are first computed by subtracting each time point image (b–e) from a copy of the pre-bleach image. The difference images are then each transformed by FFT, and displayed as a two-dimensional power spectrum with the k = 0 term at the center (f). Because the stripe is a one-dimensional pattern that varies only along the x axis (horizontal), the Fourier coefficients that show the effect of diffusive blurring are located mainly on the horizontal midline of the transform, with the k = 0 coefficient at the center. For each FRAP image, a 21 × 256 mid-section from the corresponding power spectrum is shown in linear gray scale and in logarithmic gray scale. Almost all of the spectral power is in the low spatial frequencies to the immediate left and right of the k = 0 coefficient. (g) Plots of PSD along the midline from the linear scale images in (f); t =3 (open squares), t = 5 (filled triangles), t = 8 (open circles) and t = 12 (filled squares). Diffusive blurring of the FRAP pattern is seen in both (f) and (g) as a narrowing of the power spectrum with time. Because the power spectrum is the square modulus of the Fourier transform, the PSD relaxation rate is exp[−2Dk2t], rather than exp[−Dk2t]. A logarithmic plot of PSD versus time at fixed k therefore should be linear, with a slope equal to −2Dk2. For the eight lowest-frequency values of k in (g) this log-linear relation is shown in (h); from top to bottom, k = 0.024, 0.049, 0.074, 0.098, 0.123, 0.147, 0.172 and 0.196 radians per pixel. The slopes from (h) should be linear when plotted against k2, as shown in (i). The slope of the plot in (i) is therefore −2D. Fourier analysis is facilitated by use of ImageJ 1.37v in which the FFT menu item can be set to display the unscaled (raw) power spectrum. This is the source of the data points plotted in (g). In plot (i), the slope equals −6.7924 with units of pixels2/sec. To get D in μm2/sec or cm2/sec, the numerical value (6.7924/2) must be multiplied by the square of the demagnified pixel spacing—in this case 0.323 μm/pixel. In the example shown, D=(6.7924/2) × (0.323)2=0.35μm2/sec, or 3.5 × 10⁻⁹ cm2/sec.
-
13
Compute difference images using the image calculator in ImageJ with Image Calculator or the Image Calculator Plus plugin.
-
14
Run fast Fourier transforms (FFTs under the Process option), which produce unscaled power spectral density (PSD) images.
-
15
In each image produced in Step 14, locate the center of the power spectrum (i.e., the central pixel in the PSD image with the greatest intensity). The PSD image is symmetric about this pixel. Select one pixel to the left or right of the central pixel and tabulate the intensity at this position for each time point.
-
16
Plot the natural logarithm of the intensities of the values found in Step 15 (i.e., ln(PSD(k,t)) versus t, where t is the time in seconds after photobleaching. Figure 2h shows examples of this plot for eight different values of k. The slope of each line equals −2Dk2, where k equals 2πN/L, where N equals the number of pixels from the center and L is the width of the square subregion in microns. Thus, from the slope and k, D can be calculated in units of μm2 s−1.

Cross–correlation (CC) analysis
-
17
For pixel-by-pixel CC calculations, use the CC calc plugin. CC calc.java was written by Arvonn Tully and is available at http://shell.abtech.org/~tully/ImageJ/index.html. For a given experimental condition (e.g., control), we acquire nine images. After discarding out of focus images, calculate the CC between neighboring images. Use the mean value for further analysis. Because CC drops with increased motion, we calculated a mobility index (1−CC) to quantify mobilization2.
Troubleshooting
Troubleshooting advice can be found in Table 1.
Timing
Obtain Drosophila stock that expresses ANF-GFP and wait for appearance of wandering third instar larvae on the side of vial; <2 weeks
Dissect and fillet wandering larva from an established stock; 5–10 min
Electrically stimulate motor nerve; 10–30 min
Photobleach the region of interest and monitor FRAP; 20 min
Analyze release; 15 min
Fourier analysis of FRAP; ≥30 min, depending on the size of the data set
Correlation analysis; ≥30 min, depending on the size of the data set
Anticipated results
The above protocol details how to use fluorescence microscopy to image neuropeptide vesicle behavior in the Drosophila NMJ. These methods were used to demonstrate vesicle mobilization at synapses for the first time and to discover the unanticipated phenomena of activity-dependent capture of transiting vesicles and post-tetanic potentiation of neuropeptide release2,3. For example, fluorescence intensity measurements reveal release as a loss of peptide signal and the following recovery of peptide fluorescence (Fig. 3), which flux analysis revealed is due to capture of transiting vesicles3. Furthermore, mobilization can be detected by correlation analysis in time-lapse experiments (Fig. 4) or FRAP (Fig. 5). In fact, the data acquisition and analysis techniques described here are not limited to any one preparation or fluorophore and so will be applicable in addressing many key issues in the field of synaptic function and plasticity, especially as investigators move from in vitro to in vivo preparations.

(a) Release and refilling of stores due to vesicle capture measured from whole strings of boutons. Frame 1, before stimulation; frame 2, immediately following a 3-min-long K+-induced depolarization in HL3; frame 3, 5 min later. Numbers represent the results from seven independent experiments. Scale bar, 2 μm. (b) Neuropeptide accumulation increased in synaptic boutons following release evoked by K+-induced depolarization for 3 min in high-K+ standard saline (squares) and by 70 Hz electrical nerve stimulation for 15 s in HL3 (circles) (n = 4).

(a) Top (F), wide-field neuropeptide vesicle fluorescence images of a type Ib bouton before (Con.) and after a 15-s 70-Hz stimulus (Stim.). Lower (ΔF), the change in the top images that occurred in 3 s. Note that release, measured as the change in total neuropeptide fluorescence, in the 3-s interval is negligible and so the ΔF images reflect vesicle motion. Scale bar, 2 μm. (b) Time course of neuropeptide vesicle motion after 1-s (circles) or 5-s (triangles) 70-Hz stimulations (n = 6).

Left, raw data; right, quantified results from a series of experiments. Note that FRAP is slow and incomplete when the preparation is at rest, but that stimulation induces full recovery. Thus, at rest, only a fraction of vesicles can move and this movement is slow. However, after stimulation (bar), all vesicles are in the mobile fraction.
Note: Supplementary information is available via the HTML version of this article.
References
Rao, S., Lang, C., Levitan, E.S. & Deitcher, D.L. Visualization of neuropeptide expression, transport, and exocytosis in Drosophila melanogaster . J. Neurobiol. 49, 159–172 (2001).
Shakiryanova, D., Tully, A., Hewes, R.S., Deitcher, D.L. & Levitan, E.S. Activity-dependent liberation of synaptic neuropeptide vesicles. Nat. Neurosci. 8, 173–178 (2005).
Shakiryanova, D., Tully, A. & Levitan, E.S. Activity-dependent synaptic capture of transiting peptidergic vesicles. Nat. Neurosci. 9, 896–900 (2006).
Sturman, D.A, Shakiryanova, D., Hewes, R.S., Deitcher, D.L. & Levitan, E.S. Nearly neutral secretory vesicles in Drosophila nerve terminals. Biophys. J. 90, L45–L47 (2006).
Husain, Q.M. & Ewer, J. Use of targetable GFP-tagged neuropeptide for visualizing neuropeptide release following execution of a behavior. J. Neurobiol. 59, 181–191 (2004).
Heifetz, Y. & Wolfner, M.F. Mating, seminal fluid components, and sperm cause changes in vesicle release in the Drosophila female reproductive tract. Proc. Natl. Acad. Sci. USA 101, 6261–6266 (2004).
Kula, E., Levitan, E.S., Pyza, E. & Rosbash, M. PDF cycling in the dorsal protocerebrum of the Drosophila brain is not necessary for circadian clock function. J. Biol. Rhythms 21, 104–117 (2006).
Sullivan, W., Ashburner, M. & Hawley, R.S. Drosophila Protocols (Cold Spring Harbor Laboratory Press, Cold Spring Harbor, New York, USA, 2000).
Greenspan, R.J. Fly Pushing (Cold Spring Harbor Laboratory Press, Cold Spring Harbor, New York, USA, 1997).
Cattaert, D. & Birman, S. Blockade of the central generator of locomotor rhythm by noncompetitive NMDA receptor antagonists in Drosophila larvae. J. Neurobiol. 48, 58–73 (2001).
Lanni, F. & Keller, H.E. Microscopy and microscope optical systems. in Imaging Neurons—A Laboratory Manual. (eds. Yuste, R., Lanni, F. & Konnerth, A.) 1.1–1.72 (Cold Spring Harbor Laboratory Press, Cold Spring Harbor, New York, USA, 2000).
Levitan, E.S. Using GFP to image peptide hormone and neuropeptide release in vitro and in vivo . Methods 33, 281–286 (2004).
Burke, N.V. et al. Neuronal peptide release is limited by secretory granule mobility. Neuron 19, 1095–1102 (1997).
Burke, N.A. et al. Distinct structural requirements for clustering and immobilization of K+ channels by PSD-95. J. Gen. Physiol. 113, 71–80 (1999).
Vasuvedan, C. et al. The distribution and translocation of the G protein ADP-ribosylation factor 1 in live cells is determined by its GTPase activity. J. Cell Sci. 111, 1277–1285 (1998).
Rea, R. et al. Streamlined synaptic vesicle cycle in cone photoreceptor terminals. Neuron 41, 755–766 (2004).
Berk, D.A., Yuan, F., Leunig, M. & Jain, R.K. Fluorescence photobleaching with spatial Fourier analysis: measurement of diffusion in light-scattering media. Biophys. J. 65, 2428–2436 (1993).
Acknowledgements
This work is supported by a grant from the National Institutes of Health (E.S.L.: NS32385).
Author information
Authors and Affiliations
Corresponding author
Ethics declarations
Competing interests
The authors declare no competing financial interests.
Supplementary information
Supplementary Video 1
Vesicle transit through a photobleached synaptic bouton. Note that early in the movie, which was acquired at 2 Hz, that the fluorescence in one bouton drops following photobleaching. Subsequently, the movement of vesicles passing in both anterograde (to the right) and retrograde (to the left) directions is evident. FRAP is limited in the time frame of this movie because most vesicles transit through the boutons. In fact, recovery in a resting NMJ has a half life of 6 hours3 (MOV 692 kb)
Supplementary Video 2
Mobilization of neuropeptide vesicles in synaptic boutons. Time lapse movie showing limited vesicle motion within resting synaptic boutons. (MOV 431 kb)
Supplementary Video 3
Mobilization of neuropeptide vesicles in synaptic boutons. After stimulation, vesicle mobilization is evident within boutons. For studying intrabouton motion, we typically acquire images every 3 seconds. (MOV 622 kb)
Rights and permissions
About this article
Cite this article
Levitan, E., Lanni, F. & Shakiryanova, D. In vivo imaging of vesicle motion and release at the Drosophila neuromuscular junction. Nat Protoc 2, 1117–1125 (2007). https://doi.org/10.1038/nprot.2007.142
Published:
Issue Date:
DOI: https://doi.org/10.1038/nprot.2007.142
This article is cited by
-
In vivo single-molecule imaging of syntaxin1A reveals polyphosphoinositide- and activity-dependent trapping in presynaptic nanoclusters
Nature Communications (2016)
-
The Antidepressant Fluoxetine Mobilizes Vesicles to the Recycling Pool of Rat Hippocampal Synapses During High Activity
Molecular Neurobiology (2014)
-
Presynaptic Ryanodine Receptor–CamKII Signaling is Required for Activity-dependent Capture of Transiting Vesicles
Journal of Molecular Neuroscience (2009)
-
Compartment model of neuropeptide synaptic transport with impulse control
Biological Cybernetics (2008)
-
Signaling for Vesicle Mobilization and Synaptic Plasticity
Molecular Neurobiology (2008)
Comments
By submitting a comment you agree to abide by our Terms and Community Guidelines. If you find something abusive or that does not comply with our terms or guidelines please flag it as inappropriate.
