
Figure 3: Distribution of ancestral birth locations in North America associated with IBD clusters.
From: Clustering of 770,000 genomes reveals post-colonial population structure of North America
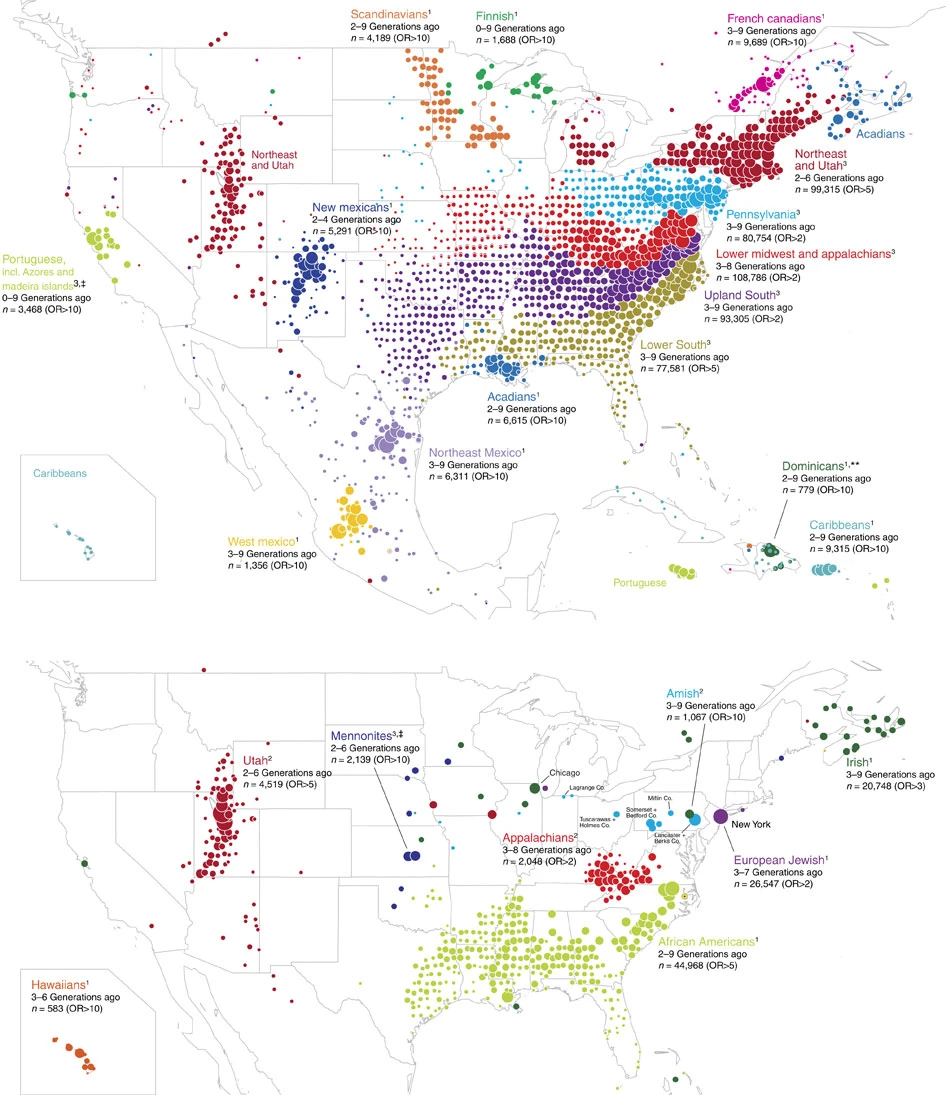
Points show pedigree birth locations that are disproportionately assigned to each cluster. Only birth locations with OR>x within indicated generations y–z are plotted, in which parameters x, y, z are chosen separately per cluster to better visualize the cluster's historical geographic concentration; full distributions of ancestral birth locations in the United States, Europe and worldwide are given in Supplementary Figs. 18–20. For each cluster, points are independently scaled by the number of pedigree annotations. See Fig. 2 and Table 1 for more details. Note that clusters are separated into two maps only for clarity. Also note that the concentration of Puerto Rican ancestors in Hawaii probably reflects their arrival there in the early 1900s (ref. 64). Maps were generated with the maps R package using data from the Natural Earth Project (1:50 m world map, version 2.0). These data are made available in the public domain (Creative Commons CC0).
