
Figure 2: Distribution of the sample sites analysed for this study (yellow) including data from the literature (green).
From: Ancestry and demography and descendants of Iron Age nomads of the Eurasian Steppe
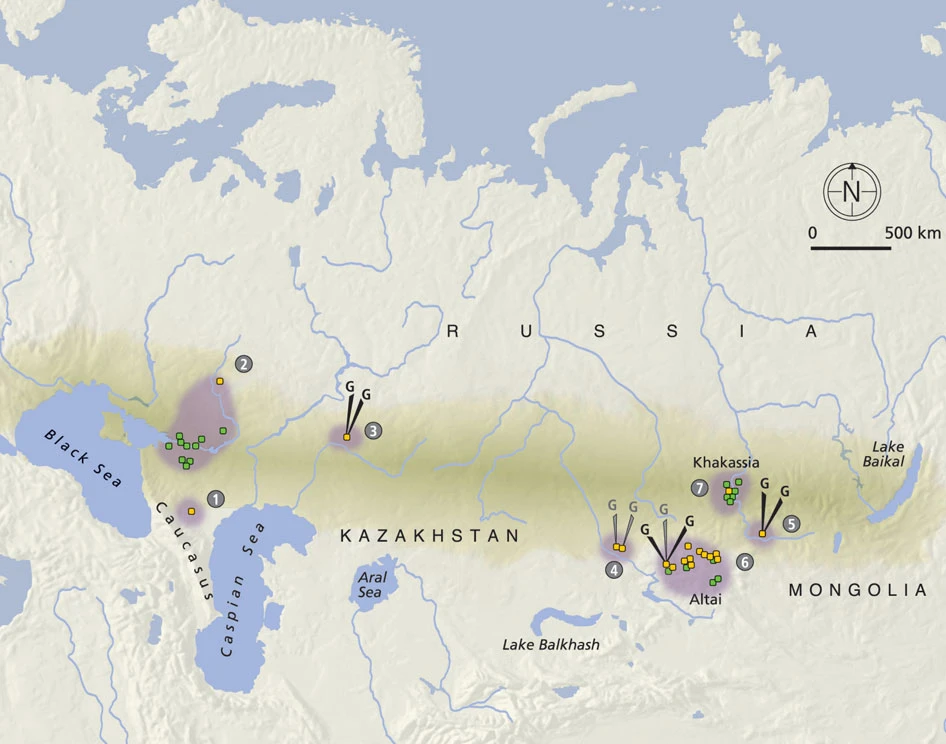
Numbers refer to the defined groups (#): WEST: #1 initial Scythian period eighth to sixth century BCE (n=4); #2 classic Scythian phase sixth to second century BCE (n=19); #3 Early Sarmatians fifth to second century BCE (n=11); EAST: #4 Zevakino-Chilikta phase ninth to seventh century BCE (n=11); #5 Aldy Bel culture seventh to sixth century BCE (n=15); #6 Pazyryk culture fourth to third century BCE (n=71); #7 Tagar/Tes culture eighth century BCE—first century CE (n=16); arrows with a G indicate samples for which genomic data was obtained, black for capture data and grey for shotgun data. Source of the map: cartomedia-Karlsruhe.
