
Abstract
Attention-deficit/hyperactivity disorder (ADHD) affects 5% of children world-wide. Of these, two-thirds continue to have impairing symptoms of ADHD into adulthood. Although a large literature implicates structural brain differences of the disorder, it is not clear if adults with ADHD have similar neuroanatomical differences as those seen in children with recent reports from the large ENIGMA-ADHD consortium finding structural differences for children but not for adults. This paper uses deep learning neural network classification models to determine if there are neuroanatomical changes in the brains of children with ADHD that are also observed for adult ADHD, and vice versa. We found that structural MRI data can significantly separate ADHD from control participants for both children and adults. Consistent with the prior reports from ENIGMA-ADHD, prediction performance and effect sizes were better for the child than the adult samples. The model trained on adult samples significantly predicted ADHD in the child sample, suggesting that our model learned anatomical features that are common to ADHD in childhood and adulthood. These results support the continuity of ADHD’s brain differences from childhood to adulthood. In addition, our work demonstrates a novel use of neural network classification models to test hypotheses about developmental continuity.
Introduction
Attention-deficit/hyperactivity disorder (ADHD) is a common disorder affecting 5% of children and 3% of adults1. It is associated with injuries2, traffic accidents3, increased health care utilization4,5, substance abuse6,7, criminality8, unemployment1, divorce9, suicide10,11, AIDS risk behaviors12, and premature mortality13. The cost of adult ADHD to society is between $77.5 and $115.9 billion each year14.
ADHD is highly heritable (76% heritability)15. A role for brain dysfunction in the etiology of ADHD was suspected for some time by the mechanism of action of the medications that treat ADHD16, as well as supported by findings from genome-wide association studies (GWAS)17,18. Although many prior magnetic resonance imaging (MRI) studies had suggested structural and functional differences between the brains of children with ADHD and those without19,20,21,22,23,24,25, machine learning (ML) MRI diagnostic classifiers for ADHD have reported inconsistent results. We and others have examined this body of literature and reported large variations in choices of MRI modalities, ML models, cross-validation and testing methods, and sample sizes. Notably, many prior studies risked data leakage and accuracy inflation by using cross-validation methods without an independent test set26. In addition, the largest dataset that ML classifiers have used thus far was the ADHD-200 Global Competition dataset consisting of 776 children, adolescents, and young adults (7–21 years old27). Only a few studies examined classifiers for adults with ADHD and they all used extremely small datasets (<100 subjects28,29,30).
The Enhancing Neuro Imaging Genetics Through Meta-Analysis (ENIGMA) ADHD Working Group created a large collaborative dataset with sufficient power to detect small effects. The ENIGMA-ADHD working group found small, statistically significant sub-cortical volumetric reductions31, cortical thinning, and reduced surface area32 to be associated with ADHD in children but not adults. Two-thirds of youth with ADHD will continue to have impairing symptoms of the disorder into young adulthood and that persistence continues to decline with age33. The term adult ADHD refers to childhood onset ADHD that has persisted into adulthood, which is how it is defined in DSM 5 and in the ENIGMA-ADHD studies. The ENIGMA-ADHD study found small but significant ADHD vs. control differences in regional volumes and cortical thicknesses for children but not adolescents or adults19,34,35. Other studies show that ADHD participants whose brains become more neurotypical were more likely than others to show remission of symptoms36,37. But, although these longitudinal studies show reductions in case vs. control differences, they also suggest that those differences should be evident to some degree in cases that persist into adulthood.
Although the expectation of finding substantial continuity between childhood and adult ADHD has been widely accepted33,38,39 and recently confirmed by a large GWAS40, this idea has been challenged41. Thus, given these prior data and the controversy about the continuity of ADHD into adulthood, we sought to test the idea that the ADHD-associated volumetric reductions seen in children with ADHD would be detected in adults with ADHD by applying ML algorithms. Given that symptoms and impairments persist into adulthood for most children with ADHD42,43, we hypothesized that ADHD-related brain structure differences in adults would be consistent with those observed in children.
Materials and methods
MRI samples
The current study was approved by all contributing members of the ENIGMA-ADHD Working Group, which provided T1-weighted structural MRI (sMRI) data from 4183 subjects from 35 participating sites (by Aug. 2019). Each participating site had approval from its local ethics committee to perform the study and to share de-identified, anonymized individual data. Images were processed using the consortium’s standard segmentation algorithms in FreeSurfer (V5.1 and V5.3)31. A total of 151 variables were used including 34 cortical surface areas, 34 cortical thickness measurements, and 7 subcortical regions from each hemisphere, and intracranial volume (ICV). Subjects missing more than 50% of variables were removed. Remaining missing values and outliers (outside of 1.5 times the interquartile range (iqr 1.5)) were replaced with imputed values using multiple imputation with chained equations in STATA15. The final ML dataset consisted 4042 subjects from 35 sites, among which 45.8% were non-ADHD controls (n = 1850, male to female ratio (m/f) = 1.42) and 54.2% ADHD participants (n = 2192, m/f = 2.79). Ages ranged from four to 63 years old; 60.7% were children (age <18 years, n = 2454) and 39.3% were adults (age ≥18 years, n = 1588). ADHD diagnosis was significantly biased by sex (X2(1) = 66.9, p < 0.0001), sites (X2(1) = 146.73, p < 0.0001), and age (X2(1) = 4.28, p = 0.04).
To balance the confounding factors, we took the following steps. First, we randomly assigned samples to training (~70%), validation (~15%), and test (~15%) subsets within each diagnosis, sex, age subgroup (child vs. adult), and site to ensure that the train/validation/test subsets have the same composition of these variables. Twelve sites that provided only cases or only controls (total 203 subjects) were excluded during the initial train/validation/test split because their samples cannot provide an unbiased learning during the training and validation steps. These samples were added to the test set for final test evaluation. Supplementary Table 1 shows the sample splitting from each site. Next, we balanced the training set for the case and control groups within each sex, age, and site subgroup by random oversampling of the under-represented diagnostic group, a procedure commonly used to deal with class imbalance. The resulting balanced training set is described in Table 1. The validation and test sets were not balanced by age, sex, and site, however due to our sample splitting procedures, they contain the same demographic samples as the training set. In addition, the test set also contains samples from sites that had been excluded from the training set due to not having a site-specific control group.
Feature preprocessing
The high correlation among the 151 MRI features suggested the need for feature dimension reduction. Many prior studies have opted for feature selection in which the most important features were retained rather than using all MRI features. Although this approach reduces the numbers of input features, it does not remove the highly correlated relationships among the selected features. As prior MRI studies also suggested small but widespread differences between children with and without ADHD, we chose to use principal factors factor analysis (PFFA) for dimension reduction. With varimax rotation, PFFA on sMRI features of the training set identified 46 factors that explained >90% of the variance. This means that the reduced numbers of 46 non-correlated factors were able to represent majority (>90%) of the variance within the training dataset. We then computed factor scores for subjects in the validation and test sets based on the training set PFFA. We compared the original MRI and PFFA features in a screening pipeline for nine different ML models (see below) to determine which set of features were better for the classifiers.
Machine learning framework
Our ML framework starts with a screening pipeline in which nine different ML models were thoroughly evaluated. We used only training and validation sets for this purpose and we also compared the results of the original MRI features and the PFFA factors. Children and adults were combined for the screening analysis. The screening pipeline utilized Scikit‐Learn’s grid search algorithm44 to search a large hyperparameter space for each of the models (see Supplementary Fig. 1 for details on these models and their hyperparameter spaces). We then compared both the training and validation scores of all the possible combinations of the hyperparameter sets. We used the area under the receiver operating characteristic (ROC) curves (AUC) as a measure of accuracy. To avoid overfitting, we chose the model having the highest validation AUC and smaller training AUC. Because multilayer perceptron (MLP) neural network models were found to be better than other models in meeting this criterion, we used MLP in the following analysis.
More detailed hyperparameter tuning for MLP was carried out using the Keras API (version 2.3.1), the TensorFlow library (version 1.14.0), and HyperOpt45. The neural network hyperparameters and their spaces are: the numbers of layers (1–3, model deteriorates quickly when more than 3 layers were used), numbers of units in each layer (4–500) and dropout rates in each layer (0.1–0.9), learning rate (0.00001–0.01) and batch normalization size (4–256). These hyperparameters were chosen for the HyperOpt tuning because of their important role in effective learning, avoiding local minimum and overfitting. The numbers of layers and units determines the complexity of the model. The ideal complexity of the neural network ensures a converging model that was able to learn the predictive features but not overfit the training examples. Early stopping was also implemented to avoid overfitting. We tested different activation functions (relu, selu, tanh), and optimizers (Adam, SGD, RMSprop, Adagrad, Adamax, Nadam). We used binary cross entropy as the loss function. Best model architecture and hyperparameters were chosen based on the lowest total validation loss. Final test scores were obtained on the test set with ensemble learning approach46. All ML algorithms were written in Python 3.5.
Analysis pipeline
Our main analysis pipeline starts with two base models that used data from the corresponding age groups during the model training and validation phase and tested also on data from their corresponding age groups. The child model used only child samples during model training, validation, and hyperparameter optimization, and tested on child test set. The adult model, similarly, was trained and validated on the adult samples and tested on the adult test set. We examined models using MRI features only, as well as those included age and sex information. We also trained a combined model that uses all the training data from both child and adult groups and compared the performance with the age-specific models.
Next, we sought to determine if the model trained and validated on the adult samples, the adult model, could be used to predict child ADHD, and vice versa. We hypothesized that if the ADHD vs. control sMRI differences seen in children are also present in adult ADHD brains, then the base models for each age group should be able to predict ADHD in the other age group. To create the largest test sets possible, we tested the child model on all the adult samples, and the adult model on all the child samples.
Model evaluation
The sigmoid function in the output layer of the neural network generates a continuous score that assesses the probability for each individual to be classified as ADHD. We name this continuous output the brain risk score. Using the brain risk scores, we calculated Cohen’s d effect sizes for child and adult test sets. We computed ROC curves and used the area under the ROC curve (AUC) as our primary measure of accuracy. The AUC and its confidence intervals were calculated in Stata 15 using the empirical method and compared with nonparametric approach by DeLong et al.47. We also computed precision-recall (PR) curves and reported the area under the PR curves, as well as the Brier loss for the final models as measures of accuracy and goodness of fit.
Results
The screening results (Supplementary Fig. 1) showed that principal factors as input features greatly improved the classifiers’ performance compared with original MRI features, as demonstrated by higher validation AUCs achieved in many models. Using principal factors, MLP outperformed all other models and was chosen as the base model and used in the following main analysis after additional fine-tuning the hyperparameters. The final MLP models’ hyperparameters were listed in Supplementary Table 2.
Figure 1A (top portion) shows the test set AUCs (as dots) and their 95% confidence intervals (as horizontal lines) for the base models using only MRI factors. The model trained and validated on child data predicted child ADHD with a significant AUC 0.64 (95%CI 0.58–0.69). In contrast, the model trained and validated on adult data was not significant AUC (0.56, 95%CI 0.49–0.62, p = 0.057). ROC curves for the two base models are in Supplementary Fig. 2A. The difference between the two base models’ AUCs was not significant (X2(1) = 3.4, p = 0.065). The areas under the precision-recall curve (AUPRC) were higher for the adult model (AUPRC = 0.74) than the child model (AUPRC = 0.68). Using the model predicted brain risk scores, we calculated the Cohen’s d effect sizes in the test set to be 0.47 for child samples (95%CI: 0.27–0.68) and 0.15 (−0.08–0.39) for the adult samples.
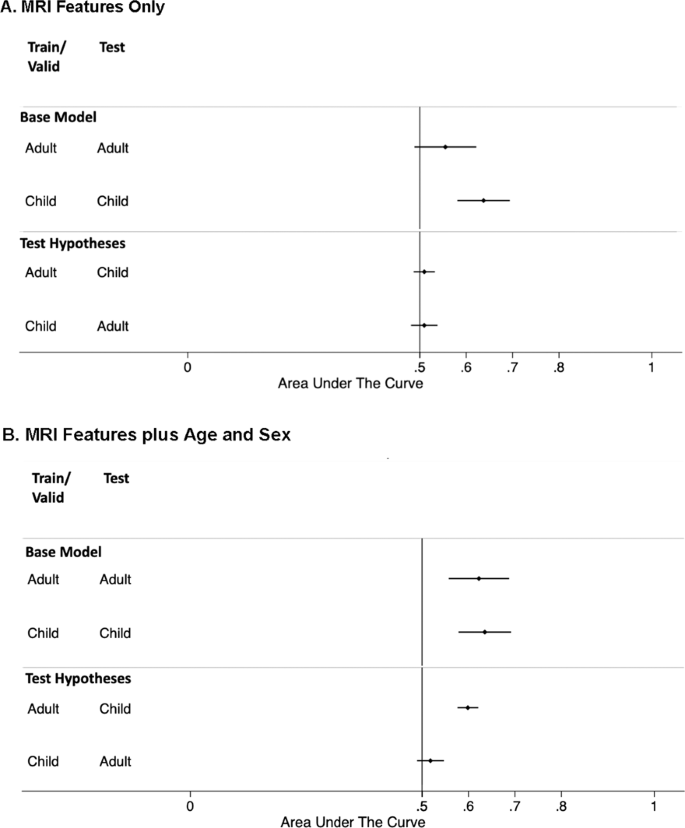
Area under the receiver operating characteristic curve (AUC) accuracy statistics for the held-out test results were plotted (as dots) with their 95% confidence intervals (as horizontal lines). The vertical line at an AUC of 0.5 indicates a chance level of diagnostic accuracy. If the 95%CI does not overlap with the 0.5 vertical line, it indicates significant predictive accuracy. A AUC comparison of the models using only MRI features. A AUC comparison of the models using MRI features plus age and sex. In both A and B, the Top portion shows the base models, where models were trained and validated in child or adult samples and tested on their corresponding age groups; Bottom portion tests the hypotheses that if model trained/validated on child samples can also predict adult ADHD and vice versa. Note that test sample consists of combined training, validation, and test sets from the other age group because they are not used in the model optimization and training.
After adding age and sex as predictors, the adult model (Fig. 1B, top) increased the AUC to 0.62 (95%CI 0.56–0.69, p = 0.002). Although prediction AUC was now significant, the increase from the base model without age and sex was not statistically significant (X2(1) = 2.01, p = 0.15). The AUPRC for the adult model also slightly increased to 0.79. Adding age and sex as predictors to the child model did not affect either the AUC, nor the AUPRC. ROC curves of two models are plotted in Supplementary Fig. 2B. The Cohen’s d effect sizes in the test set were 0.48 for children (95%CI: 0.27–0.69) and 0.39 (0.15–0.63) for adults. All above models had similarly small Brier scores (0.25).
The combined model with MRI features produced an overall test AUC of 0.60 (95%CI 0.55–0.64). The test AUC was 0.64 (95%CI 0.58–0.69) on the child subset and 0.54 (95%CI 0.47–0.60) on the adult subset, comparable to those from the age-specific models. Similarly, the combined model with MRI, age, and sex features produced an overall AUC of 0.63 (95%CI 0.59–0.67). The subset test AUC was 0.65 (95%CI 0.60–0.71) on the child subset and 0.56 (95%CI 0.49–0.63) on the adult subset, also statistically comparable to those of the age-specific models.
Because the training samples had been balanced for age and sex, these variables are not predictive of ADHD for either the child or adult test sets. To verify this, linear regression using only age and sex and their interactions to predict ADHD in the child and adult samples resulted in non-significant AUCs (child AUC 0.51, 95%CI: 0.45–0.57; adult AUC 0.46, 95%CI: 0.39–0.53).
Tests of hypotheses
For models using only MRI features, neither the adult nor child models were successful at predicting ADHD in the other age group (Fig. 1A, bottom). However, the adult model that used both MRI features and age and sex was able to predict the child samples significantly (AUC = 0.60, 95%CI: 0.58–0.62, Fig. 1B bottom). The Cohen’s d effect size for children, based on the adult model predictions, was 0.17 (95%CI: 0.10–0.24), smaller than those predicted by their age-corresponding models. The child model that used both MRI features and age and sex did not significantly predict ADHD when applied to the adult samples (AUC = 0.53, 95%CI: 0.49, 0.56, Fig. 1B bottom). ROC curves of both models tested on the different age groups are plotted in Supplementary Fig. 2C.
Discussion
Consistent with previous ENIGMA ADHD findings31,32, we found that the ability of sMRI data to discriminate people with and without ADHD is much stronger for children than adults, which is consistent with a broader literature showing that ADHD-associated structural brain differences diminish with age19,34,35,36,37. While the ENIGMA ADHD study did not find any significant differences between ADHD and control subjects for adults, our adult model did achieve a significant AUC 0.62 (95%CI 0.56–0.69) and a high area under the PR curve (AUPRC = 0.79). Consistent with the ENIGMA findings, our model-predicted brain risk scores had a larger effect size for the children than adults in both the models using MRI features and those with age and sex added. Notably, our effect sizes were two times greater than the largest of those individual regions reported in prior ENIGMA ADHD studies for both children (Cohen’s d = −0.21) and adults (Cohen’s d = −0.16)31,32.
Only a handful of prior ML studies attempted to classify ADHD from controls using only sMRI data. Most used resting-state functional MRI (rs-fMRI), or rs-fMRI in combination with another MRI modality, sometimes including cognitive measurements such as IQ. Many prior studies reported model performance on a cross-validation dataset without using an independent test set. We and many others have warned about the risk of data leakage and model overfitting when using only cross-validation without an independent test set26,48,49,50,51. Among those that reported independent test results, classification accuracies varied from 37 to 93%, with an average of 68% (ref. 26). Notably, it is difficult to directly compare the accuracy scores with our AUC scores since many of these studies used imbalanced datasets. Nevertheless, one study, among those, reported classifiers built with only sMRI features. In that study, Yoo and colleagues examined various combinations of fMRI, sMRI features, and genetic data from a balanced cohort of 94 children and adolescents. The unimodal sMRI classifier, using the cortical thickness and volumes, achieved an accuracy of 69.4% and AUC 0.65 in a small independent test set (18 ADHD and 18 typically developing children)52. Although the AUC is comparable to our child model, it is not clear how well this model would generalize to other samples given the extremely small sample sizes in both training and test sets. Nevertheless, the authors reported a better AUC (0.70) with a multimodal classifier built with features from both diffusion tensor imaging and sMRI data52.
Although our results from the child and adult base models show that sMRI data are not sufficiently predictive to be useful in clinical practice, they provide crucial pieces of evidence that will be useful in future attempts at predictive modeling. We are the first to confirm in the largest possible adult ADHD MRI sample available, that adults with ADHD differ significantly from adults without ADHD on sMRI features. Only a few prior studies attempted to classify adult ADHD from controls, but all used extremely small dataset (<100 (refs. 28,29,30)). Although these studies reported higher accuracies (74%–80%), all were based on cross-validation results and none reported prediction performance on independent test sets. The improvements we found by adding age and sex to the adult model indicate that these demographic variables must moderate the predictive ability of sMRI features. These demographics moderate the sMRI effects because our regression models show that the demographic variables on their own have no predictive utility (which was fixed in advance by balancing the case and control training samples by age and sex). It is possible that there are different age subgroups within the adult dataset that demonstrate different patterns of MRI features. For example, many regions of the brain, including prefrontal cortex, do not fully mature until early adulthood, around age 25 (ref. 53). Perhaps the age group “adults” should not include developing brains prior to age 25. However, we cannot assess for such age effects due to the sample sizes of more refined age groups. Future work should recruit more MRI data particularly for under-represented adolescent and older adult age groups. We have also shown that ML methods dramatically increase the ADHD vs. Control effect size compared with the prior univariate ENIGMA analyses.
The results from our hypothesis testing provide further information that is useful in understanding the continuity of child and adult ADHD. Consistent with our hypothesis, the adult model, trained only on adult samples, significantly predicted ADHD in the child samples. This suggests that the adult model learned combinations of structural features relevant for discriminating the sMRI scans from children with and without ADHD. This implies that some of ADHD’s sMRI differences that are relevant for persistent cases are also relevant in childhood (only some of which will be persistent into adulthood). This conclusion must, however, be considered equivocal because the child model did not successfully predict ADHD in the adult samples. To resolve this issue, future studies will need to find a way to better discriminate sMRI features associated with the onset of ADHD and those associated with the persistence of ADHD.
Our work should be interpreted in the context of several limitations. First, because we combined data across many sites, we inherit all the limitations of the original studies. Heterogeneity of methods across studies may have added noise to the combined dataset that made it difficult to discriminate the data from people with and without ADHD. Second, we only used structural imaging data. Incorporating other imaging modalities might provide clearer results and conclusions. Third, we used pre-defined structures from ENIGMA standard image processing pipeline as features. It is possible that other methods such as one using 3D images as input features, in a convolutional neural network, would uncover useful features leading to increased classification accuracy. However, the 3D images are not available. Finally, our use of neural networks makes it difficult to clarify the importance of each brain region in the model’s algorithm.
Despite these limitations, we have shown that a neural network approach is able to detect case-control sMIR differences in adults with ADHD that could not be detected with standard analyses. We have also provided some evidence for the continuity of sMRI findings from childhood into adulthood.
Code availability
The machine learning codes were freely accessible from the GitHub repository (https://github.com/ylzhang29/ADHD_MLP) for research purposes.
References
Faraone, S. V. et al. Attention-deficit/hyperactivity disorder. Nat. Rev. Dis. Primers 1, 15020 (2015).
Dalsgaard, S. et al. Effect of drugs on the risk of injuries in children with attention deficit hyperactivity disorder: a prospective cohort study. Lancet Psychiatry 2, 702–709 (2015).
Chang, Z. et al. Serious transport accidents in adults with attention-deficit/hyperactivity disorder and the effect of medication: a population-based study. JAMA Psychiatry 71, 319–325 (2014).
Biederman, J. The economic impact of adult ADHD. In Society of Biological Psychiatry: 60th Annual Scientific Convention & Program (Society of Biological Psychiatry, Atlanta, GA, 2005).
Dalsgaard, S., Nielsen, H. S. & Simonsen, M. Consequences of ADHD medication use for children’s outcomes. J. Health Econ. 37, 137–151 (2014).
Chang, Z., Lichtenstein, P. & Larsson, H. The effects of childhood ADHD symptoms on early-onset substance use: a Swedish twin study. J. Abnorm. Child Psychol. 40, 425–435 (2012).
Dalsgaard, S. et al. ADHD, stimulant treatment in childhood and subsequent substance abuse in adulthood - a naturalistic long-term follow-up study. Addict. Behav. 39, 325–328 (2014).
Lichtenstein, P. et al. Medication for attention deficit-hyperactivity disorder and criminality. N. Engl. J. Med. 367, 2006–2014 (2012).
Biederman, J. & Faraone, S.V. Economic impact of adult ADHD. In 158th Annual Meeting of the American Psychiatric Association (American Psychiatric Association, Atlanta, GA, 2005).
Ljung, T. et al. Common etiological factors of attention-deficit/hyperactivity disorder and suicidal behavior: a population-based study in sweden. JAMA Psychiatry 71, 958–964 (2014).
Furczyk, K. & Thome, J. Adult ADHD and suicide. Atten. Defic. Hyperact. Disord. 6, 153–158 (2014).
Barkley, R. A., Murphy, K. R. & Fischer, M. ADHD in Adults, What the Science Says (The Guilford Press, 2008).
Dalsgaard, S. et al. Mortality in children, adolescents, and adults with attention deficit hyperactivity disorder: a nationwide cohort study. Lancet 385, 2190–2196 (2015).
Biederman, J. & Faraone, S. V. The effects of attention-deficit hyperactivity disorder on employment and house hold income. MedGenMed 8, 12 (2006).
Faraone, S. V. & Larsson, H. Genetics of attention deficit hyperactivity disorder. Mol. Psychiatry 24, 562–575 (2018).
Faraone, S. V. The pharmacology of amphetamine and methylphenidate: Relevance to the neurobiology of attention-deficit/hyperactivity disorder and other psychiatric comorbidities. Neurosci. Biobehav. Rev. 87, 255–270 (2018).
Demontis, D. et al. Discovery of the first genome-wide significant risk loci for attention deficit/hyperactivity disorder. Nat. Genet. 51, 63–75 (2019).
Poelmans, G. et al. Integrated genome-wide association study findings: identification of a neurodevelopmental network for attention deficit hyperactivity disorder. Am. J. Psychiatry 168, 365–377 (2011).
Shaw, P. et al. Longitudinal mapping of cortical thickness and clinical outcome in children and adolescents with attention-deficit/hyperactivity disorder. Arch. Gen. Psychiatry 63, 540–549 (2006).
Seidman, L. J. et al. Dorsolateral prefrontal and anterior cingulate cortex volumetric abnormalities in adults with attention-deficit/hyperactivity disorder identified by magnetic resonance imaging. Biol. Psychiatry 60, 1071–1080 (2006).
Castellanos, F. X. et al. Developmental trajectories of brain volume abnormalities in children and adolescents with attention-deficit/hyperactivity disorder. JAMA 288, 1740–1748 (2002).
Seidman, L. J., Valera, E. M. & Makris, N. Structural brain imaging of attention-deficit/hyperactivity disorder. Biol. Psychiatry 57, 1263–1272 (2005).
Shaw, P. et al. Mapping the development of the basal ganglia in children with attention-deficit/hyperactivity disorder. J. Am. Acad. Child Adolesc. Psychiatry 53, 780–789.e11 (2014).
Mackie, S. et al. Cerebellar development and clinical outcome in attention deficit hyperactivity disorder. Am. J. Psychiatry 164, 647–655 (2007).
Valera, E. M. et al. Meta-analysis of structural imaging findings in attention-deficit/hyperactivity disorder. Biol. Psychiatry 61, 1361–1369 (2007).
Zhang-James, Y. et al. Machine learning and MRI-based diagnostic models for ADHD: are we there yet? Preprint at medRxiv https://doi.org/10.1101/2020.10.20.20216390 (2020).
Consortium, A.- The ADHD-200 consortium: a model to advance the translational potential of neuroimaging in clinical neuroscience. Front. Syst. Neurosci. 6, 62 (2012).
Yao, D. et al. Discriminating ADHD from healthy controls using a novel feature selection method based on relative importance and ensemble learning. Annu. Int. Conf. IEEE Eng. Med. Biol. Soc. 2018, 4632–4635 (2018).
Wang, X. et al. Altered regional homogeneity patterns in adults with attention-deficit hyperactivity disorder. Eur. J. Radiol. 82, 1552–1557 (2013).
Chaim-Avancini, T. M. et al. Neurobiological support to the diagnosis of ADHD in stimulant-naïve adults: pattern recognition analyses of MRI data. Acta Psychiatr. Scand. 136, 623–636 (2017).
Hoogman, M. et al. Subcortical brain volume differences in participants with attention deficit hyperactivity disorder in children and adults: a cross-sectional mega-analysis. Lancet Psychiatry 4, 310–319 (2017).
Hoogman, M. et al. Brain imaging of the cortex in ADHD: a coordinated analysis of large-scale clinical and population-based samples. Am. J. Psychiatry 176, 531–542 (2019).
Faraone, S. V., Biederman, J. & Mick, E. The age-dependent decline of attention deficit hyperactivity disorder: a meta-analysis of follow-up studies. Psychol. Med. 36, 159–165 (2006).
Shaw, P. et al. Trajectories of cerebral cortical development in childhood and adolescence and adult attention-deficit/hyperactivity disorder. Biol. Psychiatry 74, 599–606 (2013).
Shaw, P. et al. Cortical development in typically developing children with symptoms of hyperactivity and impulsivity: support for a dimensional view of attention deficit hyperactivity disorder. Am. J. Psychiatry 168, 143–151 (2011).
Shaw, P. et al. Psychostimulant treatment and the developing cortex in attention deficit hyperactivity disorder. Am. J. Psychiatry 166, 58–63 (2009).
Nakao, T. et al. Gray matter volume abnormalities in ADHD: voxel-based meta-analysis exploring the effects of age and stimulant medication. Am. J. Psychiatry 168, 1154–1163 (2011).
Franke, B. et al. Live fast, die young? A review on the developmental trajectories of ADHD across the lifespan. Eur. Neuropsychopharmacol. 28, 1059–1088 (2018).
Franke, B. et al. The genetics of attention deficit/hyperactivity disorder in adults, a review. Mol. Psychiatry 17, 960–987 (2012).
Rovira, P. et al. Shared genetic background between children and adults with attention deficit/hyperactivity disorder. Neuropsychopharmacology 45, 1617–1626 (2020).
Faraone, S. V. & Biederman, J. Can attention-deficit/hyperactivity disorder onset occur in adulthood?. JAMA Psychiatry 73, 655–656 (2016).
Faraone, S. V. et al. Diagnosing adult attention deficit hyperactivity disorder: are late onset and subthreshold diagnoses valid?. Am. J. Psychiatry 163, 1720–1729 (2006).
Sibley, M. H. et al. Defining ADHD symptom persistence in adulthood: optimizing sensitivity and specificity. J. Child Psychol. Psychiatry 58, 655–662 (2017).
Pedregosa, F. et al. Scikit-learn: machine learning in Python. J. Mach. Learn. Res. 12, 2825–2830 (2012).
Bergstra, J., Yamins, D. & Cox, D. D. Making a science of model search: hyperparameter optimizationin hundredsof dimensions for vision architectures. In Proc. 30th International Conference on Machine Learning (ICML 2013), JMLR Workshop and Conference Proceedings (Atlanta, Gerorgia, USA, 2013).
Dietterich, T. G. Ensemble methods in machine learning. In MCS ‘00: Proc. First International Workshop on Multiple Classifier Systems (Springer Verlag, New York, 2000).
DeLong, E. R., DeLong, D. M. & Clarke-Pearson, D. L. Comparing the areas under two or more correlated receiver operating characteristic curves: a nonparametric approach. Biometrics 44, 837–845 (1988).
Parmar, C. et al. Data analysis strategies in medical imaging. Clin. Cancer Res. 24, 3492–3499 (2018).
Koppe, G., Meyer-Lindenberg, A. & Durstewitz, D. Deep learning for small and big data in psychiatry. Neuropsychopharmacol. 46, 176–190, https://doi.org/10.1038/s41386-020-0767-z (2021).
Cearns, M., Hahn, T. & Baune, B. T. Recommendations and future directions for supervised machine learning in psychiatry. Transl. Psychiatry 9, 271 (2019).
Kaufman, S. et al. Leakage in data mining: formulation, detection, and avoidance. ACM Trans. Knowl. Discov. Data 6, 556–563 (2012).
Yoo, J. H., Kim, J. I., Kim, B. N. & Jeong, B. Exploring characteristic features of attention-deficit/hyperactivity disorder: findings from multi-modal MRI and candidate genetic data. Brain Imaging. Behav. 14, 2132–2147, https://doi.org/10.1007/s11682-019-00164-x (2020).
Arain, M. et al. Maturation of the adolescent brain. Neuropsychiatr. Dis. Treat. 9, 449–461 (2013).
Acknowledgements
Dr. Faraone is supported by the European Union’s Seventh Framework Programme for research, technological development and demonstration under grant agreement no. 602805, the European Union’s Horizon 2020 research and innovation programme under grant agreement nos. 667302 & 728018, and NIMH grants 5R01MH101519 and U01 MH109536-01. Dr. Franke is supported by a personal Vici grant (016-130-669) and Dr. Hoogman from a personal Veni grant (91619115), both from the Netherlands Organization for Scientific Research (NWO). The ENIGMA Working Group gratefully acknowledges support from the NIH Big Data to Knowledge (BD2K) award (U54 EB020403 to Paul Thompson). We thank Margaret Mariano and Patricia Forken for administrative assistance and proofreading the manuscript.
Author information
Authors and Affiliations
Consortia
Corresponding author
Ethics declarations
Conflict of interest
Dr. Barbara Franke has received educational speaking fees from Shire and Medice. Dr. Stephen V Faraone received income, potential income, travel expenses continuing education support and/or research support from Takeda, OnDosis, Tris, Otsuka, Arbor, Ironshore, Rhodes, Akili Interactive Labs, Enzymotec, Sunovion, Supernus, and Genomind. With his institution, he has US patent US20130217707 A1 for the use of sodium-hydrogen exchange inhibitors in the treatment of ADHD. He also receives royalties from books published by Guilford Press: Straight Talk about Your Child’s Mental Health, Oxford University Press: Schizophrenia: The Facts and Elsevier: ADHD: Non-Pharmacologic Interventions. He is Program Director of www.adhdinadults.com. Dr. Asherson has served as a consultant and as a speaker at sponsored events for Eli Lilly, Novartis, and Shire, and he has received educational/research awards from Eli Lilly, GW Pharma, Novartis, QbTech, Shire, and Vifor Pharma. Dr. Banaschewski has served in an advisory or consultancy role for Actelion, Eli Lilly, Hexal Pharma, Lundbeck, Medice, Neurim Pharmaceuticals, Novartis, Oberberg GmbH, and Shire; he has received conference support or speaking fees from Eli Lilly, Medice, Novartis, and Shire; he has been involved in clinical trials conducted by Shire and Viforpharma; and he has received royalties from CIP Medien, Hogrefe, Kohlhammer, and Oxford University Press. Dr. Bellgrove has received speaking fees and travel support from Shire. Dr. Biederman has received research support from AACAP, Alcobra, the Feinstein Institute for Medical Research, the Forest Research Institute, Genentech, Headspace, Ironshore, Lundbeck AS, Magceutics, Merck, Neurocentria, NIDA, NIH, PamLab, Pfizer, Roche TCRC, Shire, SPRITES, Sunovion, the U.S. Department of Defense, the U.S. Food and Drug Administration, and Vaya Pharma/Enzymotec; he has served as a consultant or on scientific advisory boards for Aevi Genomics, Akili, Alcobra, Arbor Pharmaceuticals, Guidepoint, Ironshore, Jazz Pharma, Medgenics, Piper Jaffray, and Shire; he has received honoraria from Alcobra, the American Professional Society of ADHD and Related Disorders, and the MGH Psychiatry Academy for tuition-funded CME courses; he has a financial interest in Avekshan, a company that develops treatments for ADHD; he has a U.S. patent application pending (Provisional Number #61/233,686) through MGH corporate licensing, on a method to prevent stimulant abuse; and his program has received royalties from a copyrighted rating scale used for ADHD diagnoses, paid to the Department of Psychiatry at Massachusetts General Hospital by Ingenix, Prophase, Shire, Bracket Global, Sunovion, and Theravance. Dr. Brandeis has served as an unpaid scientific consultant for an EU-funded neurofeedback trial. Dr. Buitelaar has served as a consultant, advisory board member, and/or speaker for Eli Lilly, Janssen-Cilag, Medice, Roche, Shire, and Servier. Dr. Coghill has served in an advisory or consultancy role for Eli Lilly, Medice, Novartis, Oxford Outcomes, Shire, and Viforpharma; he has received conference support or speaking fees from Eli Lilly, Janssen McNeil, Medice, Novartis, Shire, and Sunovion; and he has been involved in clinical trials conducted by Eli Lilly and Shire. Dr. Dale is a founder of and holds equity in CorTechs Labs, Inc., and has served on the scientific advisory boards of CorTechs Labs and Human Longevity, Inc., and he receives funding through research grants with GE Healthcare. Mr. Earl is co-inventor of the Oregon Health and Science University Technology #2198 (co-owned with Washington University in St. Louis), FIRMM: Real time monitoring and prediction of motion in MRI scans, exclusively licensed to Nous, Inc., and any related research. Any potential conflict of interest has been reviewed and managed by OHSU. Dr. Fair is a founder of Nous Imaging, Inc.; any potential conflicts of interest are being reviewed and managed by OHSU. Dr. Haavik has received speaking fees from Biocodex, Eli Lilly, HB Pharma, Janssen-Cilag, Medice, Novartis, and Shire. Dr. Hoekstra has received a research grant from and served on the advisory board for Shire. Dr. Karkashadze has received payment for article authorship and speaking fees from Sanofi and from Pikfarma. Dr. Konrad has received speaking fees from Eli Lilly, Medice, and Shire. Dr. Kuntsi has received speaking honoraria and advisory panel payments for participation at educational events sponsored by Medice; all funds are received by King’s College London and used for studies of ADHD. Dr. Lesch has served as a speaker for Eli Lilly and has received research support from Medice and travel support from Shire. Dr. Mattos has served on speakers’ bureau and/or as a consultant for Janssen-Cilag, Novartis, and Shire and has received travel awards from those companies to participate in scientific meetings; the ADHD outpatient program (Grupo de Estudos do Déficit de Atenção/Institute of Psychiatry) chaired by Dr. Mattos also received research support from Novartis and Shire. Dr. Mehta has received research funding from Lundbeck, Shire, and Takeda and has served on advisory boards for Lundbeck and Autifony. Dr. Ramos-Quiroga has served on the speakers bureaus and/or as a consultant for Almirall, Braingaze, Eli Lilly, Janssen-Cilag, Lundbeck, Medice, Novartis, Shire, Sincrolab, and Rubió; he has received travel awards for taking part in psychiatric meetings from Eli Lilly, Janssen-Cilag, Medice, Rubió, and Shire; and the Department of Psychiatry chaired by him has received unrestricted educational and research support from Actelion, Eli Lilly, Ferrer, Janssen-Cilag, Lundbeck, Oryzon, Psious, Roche, Rubió, and Shire. Dr. Reif has received honoraria for serving as speaking or on advisory boards for Janssen, Medice, Neuraxpharm, Servier, and Shire. Dr. Rubia has received speaking fees form Shire and Medice and a grant from Eli Lilly. Dr. Thompson has received funding support from Biogen. Dr. Van Erp has served as consultant for Roche Pharmaceuticals and has a contract with Otsuka Pharmaceutical, Ltd. Dr. Walitza has received lecture honoraria from Eli Lilly and Opopharma, support from the Hartmann Müller, Olga Mayenfisch, and Gertrud Thalmann foundations, and royalties from Beltz, Hogrefe, Kohlhammer, Springer, and Thieme. Dr. Yanli Zhang-James is supported by the European Union’s Seventh Framework Programme for research, technological development, and demonstration under grant agreement no. 602805 and the European Union’s Horizon 2020 research and innovation programme under grant agreement no. 667302. Emily C Helminen, Jinru Liu, Dr. Martine Hoogman, and other contributing members of the ENIGMA-ADHD Working Group declare no conflict of interest.
Additional information
Publisher’s note Springer Nature remains neutral with regard to jurisdictional claims in published maps and institutional affiliations.
A list of the ENIGMA-ADHD Working Group members and their affiliations are listed at the end of the paper.
Supplementary information
Rights and permissions
Open Access This article is licensed under a Creative Commons Attribution 4.0 International License, which permits use, sharing, adaptation, distribution and reproduction in any medium or format, as long as you give appropriate credit to the original author(s) and the source, provide a link to the Creative Commons license, and indicate if changes were made. The images or other third party material in this article are included in the article’s Creative Commons license, unless indicated otherwise in a credit line to the material. If material is not included in the article’s Creative Commons license and your intended use is not permitted by statutory regulation or exceeds the permitted use, you will need to obtain permission directly from the copyright holder. To view a copy of this license, visit http://creativecommons.org/licenses/by/4.0/.
About this article

Cite this article
Zhang-James, Y., Helminen, E.C., Liu, J. et al. Evidence for similar structural brain anomalies in youth and adult attention-deficit/hyperactivity disorder: a machine learning analysis. Transl Psychiatry 11, 82 (2021). https://doi.org/10.1038/s41398-021-01201-4
Received:
Revised:
Accepted:
Published:
DOI: https://doi.org/10.1038/s41398-021-01201-4
This article is cited by
-
Home-based brain–computer interface attention training program for attention deficit hyperactivity disorder: a feasibility trial
Child and Adolescent Psychiatry and Mental Health (2023)
-
Predicting childhood and adolescent attention-deficit/hyperactivity disorder onset: a nationwide deep learning approach
Molecular Psychiatry (2023)
-
Predicting individual cases of major adolescent psychiatric conditions with artificial intelligence
Translational Psychiatry (2023)
-
Machine learning in attention-deficit/hyperactivity disorder: new approaches toward understanding the neural mechanisms
Translational Psychiatry (2023)
-
Gray matter volumetric correlates of attention deficit and hyperactivity traits in emerging adolescents
Scientific Reports (2022)
