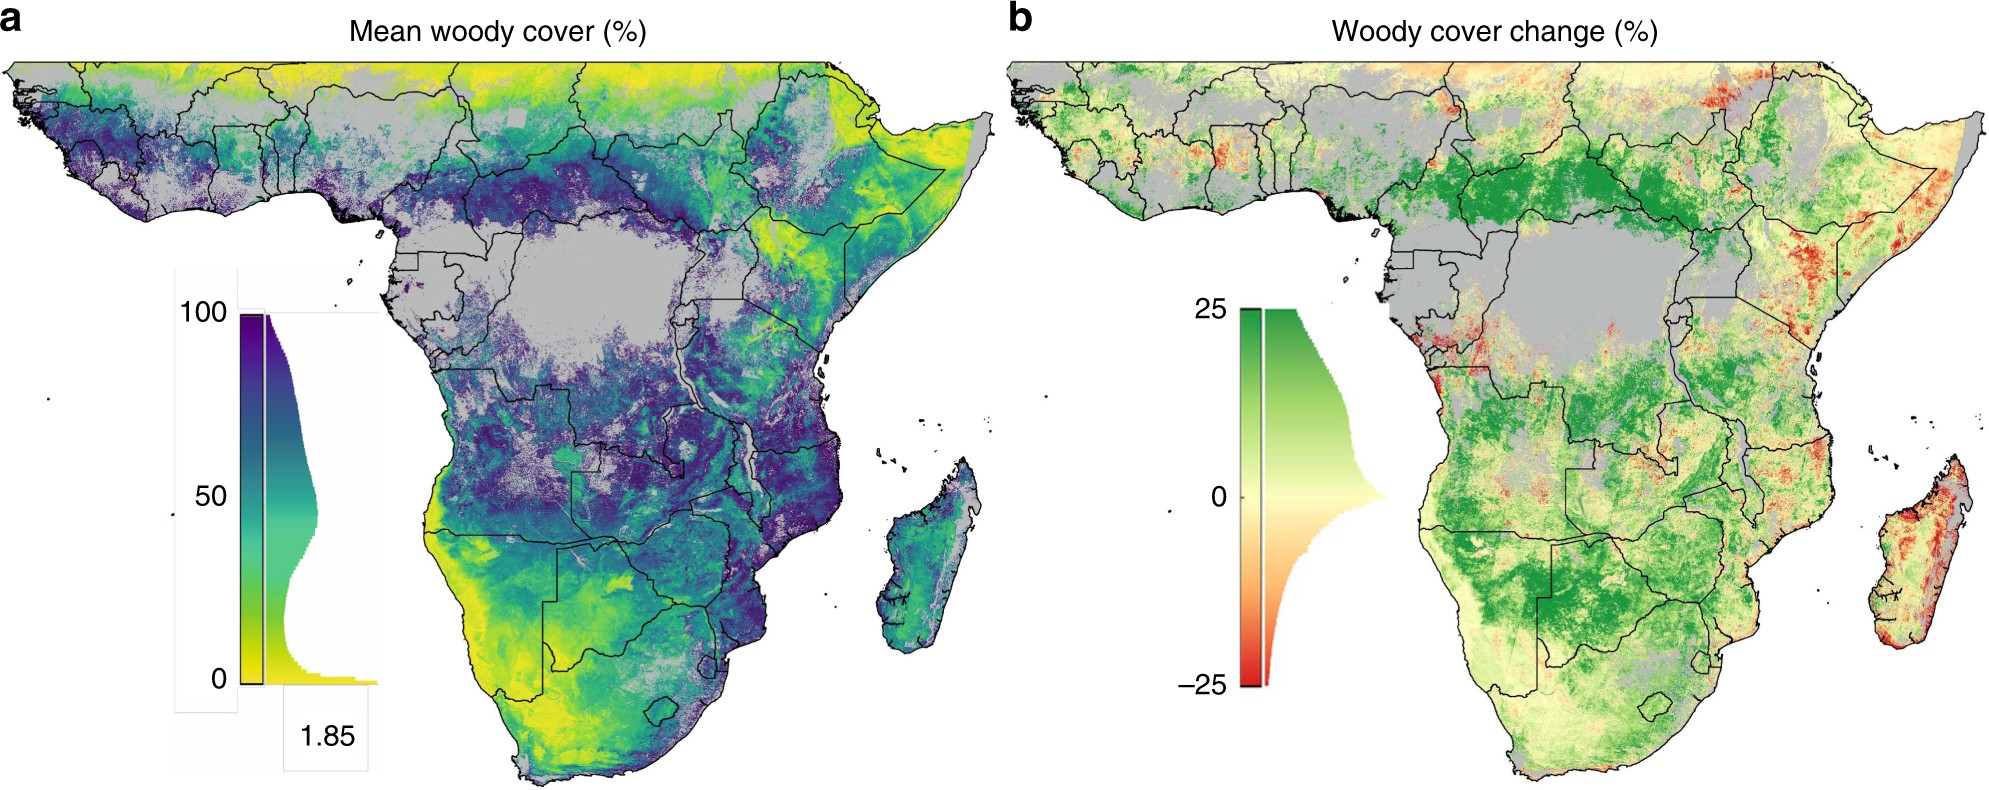
Fig. 1

Woody plant cover dynamics over sub-Saharan Africa. Satellite observations of 30 years of fractional woody plant cover (a) reveal a dominant increasing trend (derived from the slope of the linear trend line between 1986 and 2016) (b). Histograms alongside colour scales indicate data distributions. Grey areas were masked from the analysis and represent urban surfaces, wetland, cropland, and forest (areas >40% cover by trees >5 m). Maps were constructed in Google Earth Engine46
