
Abstract
TFE3-translocation renal cell carcinoma (TFE3-tRCC) is a rare and heterogeneous subtype of kidney cancer with no standard treatment for advanced disease. We describe comprehensive molecular characteristics of 63 untreated primary TFE3-tRCCs based on whole-exome and RNA sequencing. TFE3-tRCC is highly heterogeneous, both clinicopathologically and genotypically. ASPSCR1-TFE3 fusion and several somatic copy number alterations, including the loss of 22q, are associated with aggressive features and poor outcomes. Apart from tumors with MED15-TFE3 fusion, most TFE3-tRCCs exhibit low PD-L1 expression and low T-cell infiltration. Unsupervised transcriptomic analysis reveals five molecular clusters with distinct angiogenesis, stroma, proliferation and KRAS down signatures, which show association with fusion patterns and prognosis. In line with the aggressive nature, the high angiogenesis/stroma/proliferation cluster exclusively consists of tumors with ASPSCR1-TFE3 fusion. Here, we describe the genomic and transcriptomic features of TFE3-tRCC and provide insights into precision medicine for this disease.
Introduction
TFE3-translocation renal cell carcinoma (TFE3-tRCC) is a rare subtype of kidney cancer, characterized by Xp11.2 translocations resulting in TFE3 fusion with various partner genes. To date, more than 20 partner genes have been identified in fusions with TFE3, including SFPQ, ASPSCR1, NONO, PRCC, RBM10, MED15, etc. Due to the variety of partners and fusion structures, the function of chimeric TFE3 fusion proteins is diverse, which may contribute to the high degree of heterogeneity of TFE3-tRCC, both morphologically and clinically1,2,3,4,5. Although only 1–4% RCCs in adults may have TFE3 translocations6,7, TFE3-tRCC constitutes 15% of RCCs in patients <45 years of age and 20–50% of pediatric RCCs8,9. Unfortunately, owing to the limited understanding of the underlying mechanisms10, the optimal therapy for TFE3-tRCC remains to be determined, prompting an urgent clinical need to molecularly characterize TFE3-tRCC.
Before this study, our knowledge concerning the molecular features of TFE3-tRCC was limited as previous analyses contained relatively small cohorts and were mainly confined to genomic alterations11,12,13,14. Although TFE3-tRCC was found to have few recurrent mutations, prior reports revealed the association between the somatic copy number alterations (SCNA) and survival outcomes11,12,13. However, these genomic alterations found in tumors were not enough to explain the high heterogeneity of TFE3-tRCC. The comprehensive genomic, especially the transcriptomic, characteristics of TFE3-tRCC are still uncovered.
In this study, we apply whole-exome sequencing (WES) on 53 TFE3-tRCCs and RNA sequencing (RNA-seq) on 63 TFE3-tRCCs to reveal their genomic and transcriptomic characteristics and discover molecular mechanisms potentially involved in tumor progression. Our analyses reveal the prognostic value of ASPSCR1-TFE3 fusion and SCNAs for TFE3-tRCC, identify five molecular subsets with distinct transcriptional signatures.
Results
Identification and clinicopathologic features of TFE3-tRCC
From 2009 to 2019, a total of 68 patients with TFE3-tRCC were identified from 4581 RCC cases (Supplementary Figure 1). The baseline clinicopathologic characteristics of the cases with TFE3-tRCC are summarized in Table 1 and Supplementary Data 1. The median age at diagnosis was 32.5 years (range: 5–70 years) and nine (13.2%) patients were younger than 18 years old. The male: female ratio was 2:3. The median tumor size was 4.7 cm (range: 1.4–19.6 cm). At initial diagnosis, 16 (23.5%) and seven (10.3%) patients presented with regional lymph node metastasis and distant metastasis, respectively. Morphologically, TFE3-tRCCs presented with diverse architectural and cytologic features, including papillary, tubular, acinar, and cystic patterns and 37 (54.4%) tumors had an international society of urological pathology (ISUP) grade ≥3. For primary kidney tumors, 27 (39.7%) and 41 (60.3%) patients underwent nephron-sparing surgery and radical nephrectomy, respectively. Ten (14.7%) patients died at the end of follow-up (median 43.8 months, 95% CI: 31.5–56.1).
Identification of TFE3-fusion partners and structures
RNA-seq was performed on 63 TFE3-tRCC tumors and 14 adjacent normal kidney tissues. Gene fusions were detected in 90.5% (57/63) cases, of which 94.7% (54/57) cases showed relatively more common gene fusions, including SFPQ-TFE3 (n = 15), ASPSCR1-TFE3 (n = 13), NONO-TFE3 (n = 8), MED15-TFE3 (n = 8), PRCC-TFE3 (n = 6), and RBM10-TFE3 fusions (n = 4) (Fig. 1A). Three (5.3%, 3/57) cases were identified with rare TFE3-associated gene fusions, including FUBP1-TFE3, SETD1B-TFE3, and ZC3H4-TFE3, of which FUBP1-TFE3 and SETD1B-TFE3 fusion showed previously unreported fusion structures. FUBP1-TFE3 fusion resulted in a chimeric transcript composed of exons 1–15 of FUBP1 and exons 3–10 of TFE3, and SETD1B-TFE3 fusion was composed of exons 1–4 of SETD1B and exons 4–10 of TFE3. All three rare gene fusions were confirmed by RT-PCR and Sanger sequencing (Supplementary Figure 2). Patients with SETD1B-TFE3 and ZC3H4-TFE3 fusion developed metastasis by the end of follow-up.
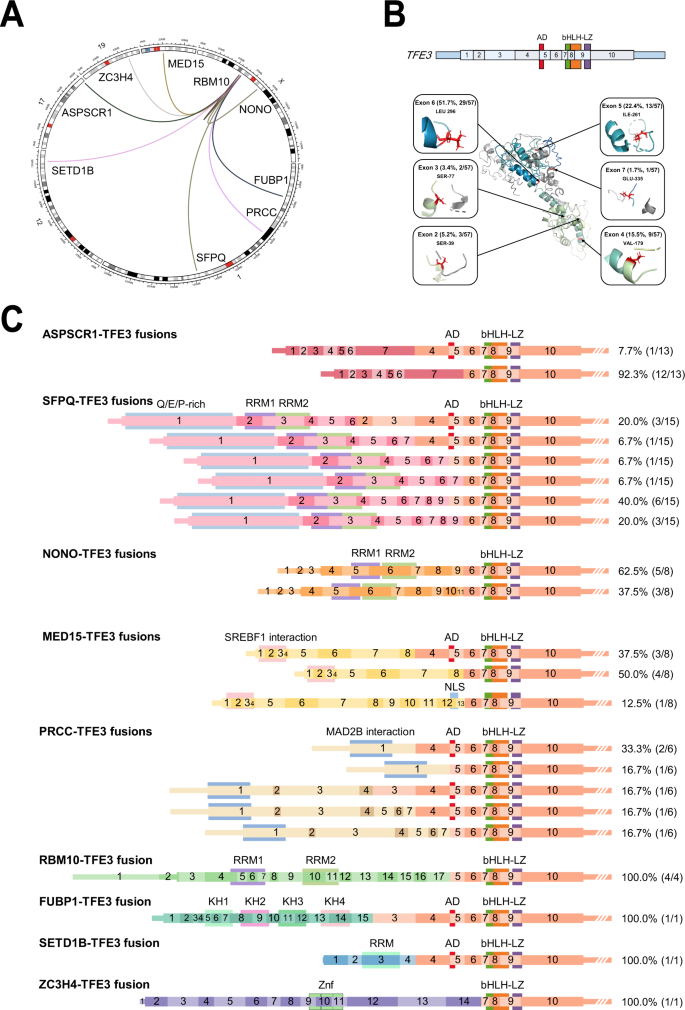
A The circle represents TFE3 gene fusions in our TFE3-tRCC cohort. B Exons and function domains for TFE3 gene (top). Protein domains are color-coded and depicted. Mapping of breakpoints onto the three-dimensional structure of TFE3 protein (bottom). C Exons and functional domains of the TFE3 and fusion partner genes detected in our TFE3-tRCC cohort. TFE3-tRCC TFE3-translocation renal cell carcinoma, AD strong transcription activation domain, bHLH basic helix–loop–helix domain, LZ leucine zipper domain, RRM RNA-recognition motif, SREBF1 Sterol Regulatory Element Binding Transcription Factor 1, MAD2L2 mitotic spindle assembly checkpoint protein MAD2B, KH K homology domain, Znf zinc-finger domains.
The structures of the TFE3 fusion isoforms identified in our cohort are summarized in Fig. 1B and C. All fusion genes preserved the open reading frame between the 5′ terminal of partner genes and the 3′ terminal of TFE3. According to the retained exons and functional domains of the TFE3, six types of isoforms were found, including retained fragment of TFE3 2–10 exons (5.3%, 3/57), 3–10 exons (3.5%, 2/57), 4–10 exons (15.8%, 9/57), 5–10 exons (22.8%, 13/57), 6–10 exons (50.9%, 29/57), and 7–10 exons (1.7%, 1/57). All fusions retained exons 7–10 of the TFE3 gene, containing the helix–loop-helix (bHLH) and leucine zipper (LZ) domains, but only a subset (47.4%, 27/57) of fusion isoforms contained the transcription activation (AD) domain.
The fusion isoforms of different TFE3-tRCC subtypes were highly heterogeneous (Fig. 1C and Supplementary Data 2). Among which, SFPQ-TFE3 fusion isoforms had a maximum of six fusion structures, in contrast, ASPSCR1-TFE3 and RBM10-TFE3 isoforms had relatively fixed fusion structures. Next, we analyzed the functional domains of the retained exons of the fusion partner genes (Fig. 1C). We found 42% of fusion partner genes retained all functional domains. Interestingly, fusion partners that play regulatory roles in mRNA processing and/or mRNA splicing, including NONO, SFPQ, and RBM10, retained all RNA-recognition motifs (RRM).
TFE3-fusion partners impact tumor phenotype and survival outcomes
We subsequently explored the association of clinicopathologic features with different TFE3 fusion subtypes. Morphologically, we found tumors harboring ASPSCR1-TFE3 fusion showed a predominated papillary pattern, and tumors with MED15-TFE3 fusion showed a dominant multicystic pattern (Supplementary Figure 3A). Radiologically, cases with ASPSCR1-TFE3 fusion presented with features typical of hypervascularity and calcification on CT scan, while MED15-TFE3 fusion tRCC often presented as cystic masses (Supplementary Figure 3B).
Of note, compared with other TFE3-tRCC subtypes, tumors with ASPSCR1-TFE3 fusion were highly aggressive, characterized by higher ISUP nuclear grade (ISUP ≥ 3, 11/13 vs. 19/44, P = 0.017) and more frequent lymph node metastasis (6/13 vs. 7/44, P = 0.057, Supplementary Table 1). At the end of follow-up, a total of 20 patients had presented with distal metastasis, of which over one-third were ASPSCR1-TFE3 fusion tRCCs (7/20, 35%). Survival analysis showed that those with ASPSCR1-TFE3 fusion were associated with poor overall survival (OS) compared with other subtypes (median OS: 58.5 months vs. not reached, P = 0.011, Fig. 2A and B). In multivariate analysis, after adjusting for clinicopathologic features, the ASPSCR1-TFE3 fusion was still independently associated with poor outcome (P = 0.010, Supplementary Table 2 and Supplementary Figure 4).
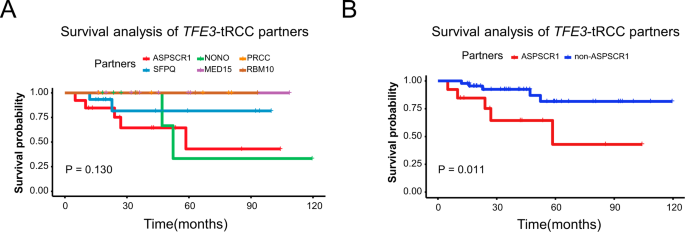
A Kaplan–Meier curves show the OS for patients with different TFE3-fusion subtypes. A Kaplan–Meier curves show the OS for patients with ASPSCR1-TFE3 fusion and non- ASPSCR1-TFE3 fusion. P-value was determined by two-sided log-rank test (A, B). TFE3-tRCC TFE3-translocation renal cell carcinoma, OS overall survival.
Somatic mutational landscape of TFE3-tRCC
WES was performed on 53 TFE3-tRCCs and matched germline samples. We identified a total of 1591 somatic mutations, including 1486 nonsynonymous single-nucleotide variants (SNVs) and 105 insertions/deletions (Indels), with a median of 14 (range: 0–238) mutations per tumor (Fig. 3A). The tumor mutation burden (median 0.28, range: 0–4.76) in our TFE3-tRCC cohort was lower than that of KIRC and KIRP in TCGA cohort (Supplementary Figure 5). We extracted three prominent mutational signatures using a non-negative matrix factorization (NMF) algorithm (Supplementary Figure 6). Signature B shows the largest contribution, which is found to be similar to SBS40, a signature correlated with age in multiple types of cancer15. Signature A is similar to both the SBS87 (thiopurine exposure) and SBS1 (age-related 5-methylcytosine deamination). Signature C, which highly corresponds to SBS22 (cosine similarity = 0.91), is characterized by T > A transversions at CT [A/G] and has been associated with aristolochic acid exposure. We observed Signature C in 28.8% of patients in our cohort, indicating a potential role of aristolochic acid exposure in the development of Chinese TFE3-tRCC. The frequently mutated genes (frequency of more than four samples) included DST, DNAH8, and HMHA1, whereas the mutated loci at each gene were not recurrent (Fig. 3B and Supplementary Data 3). In addition, six tumor suppressor genes previously implicated in cancer (BTK, CHD1, FN1, NFATC2, NOTCH1, and NRP1) were found in at least two samples (Fig. 3B). Of these, 75% (9/12) were clonal mutations (Supplementary Data 3). In line with previous studies, the mutational spectrum of TFE3-tRCC was quite heterogeneous. Survival analysis indicated no relation between frequent SNVs and patient survival (Supplementary Table 3).
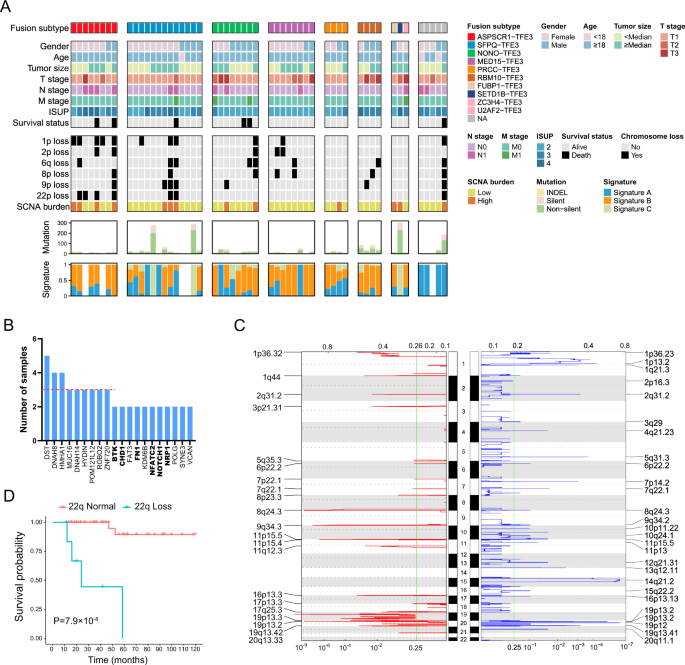
A Clinical features and molecular data for 53 tumors (rows) are displayed as heatmaps. Each column represents an individual tumor. Patients were separated into eight groups: those with ASPSCR1-TFE3 (n = 8), with SFPQ-TFE3 (n = 13), with NONO-TFE3 (n = 8), with MED15-TFE3 (n = 8), with PRCC-TFE3 (n = 4), with RBM10-TFE3 fusions (n = 4), with rare TFE3-associated gene fusions (n = 3, including FUBP1-TFE3, SETD1B-TFE3, and ZC3H4-TFE3) and unknow partners (n = 5). The top panel shows fusion partners. The middle panel shows clinical features, including gender, age, tumor size, TNM stage, ISUP, survival status, SCNA, and SCNA burden. Each subsequent panel displays a specific molecular profile: number of mutations and the fraction of each COSMIC signature in the genome. B Frequently mutated genes in the TFE3-tRCC cohort. The red dashed line denotes three mutated patients. Tumor suppresser genes are labeled with bold font. C Focal amplification and deletion determined from GISTIC 2.0 analysis. The green line indicates the cut-off for significance (q = 0.25). P values significantly peaks were identified at FDR q value <0.25. The top and bottom numerical values refer to G-scores and q values, respectively. D Kaplan–Meier curves show the OS between the patients with 22p loss and 22p normal. P value was determined by two-sided log-rank test. TFE3-tRCC TFE3-translocation renal cell carcinoma, ISUP International Society of Urological Pathology, SCNA somatic copy number alteration, OS overall survival.
The most frequently observed individual arm-level events included gain of 17q (12/53, 23%) and 19p (11/53, 21%), and loss of 19p (16/53, 30%), 14q (14/53, 26%), and 1p (11/53, 21%). The most frequent focal events were gain of 19p13.2 (17/53, 32%), 1q44 (15/53, 28%), and 8q24.3 (13/53, 25%), and loss of 19p12 (15/53, 26%), 14q21.2 (13/53, 25%, Fig. 3C and Supplementary Data 4). Previous studies reported that certain copy number events (eg. 9p loss and 17q gain) were correlated with patient outcomes, therefore, we evaluated the association of SCNA with clinicopathologic features and prognosis in our TFE3-tRCC cohort (Supplementary Table 4). We found that tumors with 22q loss were correlated with ASPSCR1-TFE3 fusion (4/4 vs. 2/38, P = 0.005), higher ISUP nuclear grade (ISUP ≥ 3, 7/19 vs. 0/27, P = 0.004) and more frequent lymph node metastasis (5/7 vs. 2/39, P = 0.004). Cases with 9p loss were associated with increased lymph node metastasis (4/8 vs. 2/39, P = 0.019). Survival analysis indicated that loss of chromosome arms 1p, 2p, 6q, 8p, 9p, and 22q were predictors for poor OS (Supplementary Figure 7 and Fig. 3D). Moreover, we identified that tumors with higher SCNA burden significantly correlated with worse survival outcomes (median OS: 59.46 months vs. 111.28 months, P = 0.006). After adjustment for clinicopathologic features, 22q loss was identified as an independent predictor for poor OS (P = 0.004, Supplementary Table 2 and Supplementary Figure 4).
Transcriptional landscape and immune microenvironment features of TFE3-tRCC
Analysis of differentially expressed genes (DEG) identified a total of 3124 over-expressed and 2143 under-expressed genes in TFE3-tRCCs compared to adjacent normal tissues (Fig. 4A and Supplementary Data 5). Among them, GPNMB, HIF1A, MET, and BIRC7, which were previously reported to have higher expression in tRCC16,17, were also upregulated in our TFE3-tRCC cohort (Supplementary Figure 8A). Kyoto Encyclopedia of Genes and Genomes (KEGG) pathway analysis identified that lysosomal, autophagy, and innate immunity pathways were significantly upregulated in TFE3-tRCC (Fig. 4B). Gene set enrichment analysis (GSEA) demonstrated enrichment of transcriptional pathways involved in proliferation (E2F targets and G2M checkpoint), PI3K/ATK/mTOR, and p53 signaling in TFE3-tRCC (Fig. 4C).

A A volcano plot representing differentially expressed genes between the tumors and paired adjacent normal tissues. Significantly upregulated genes are colored in red, whereas significantly downregulated genes are colored in blue. The q values (-log10 p) were calculated using paired two-sided moderated Student’s t test. B Kyoto Encyclopedia of Genes and Genomes enrichment analysis of differentially expressed genes. Enrichment q values (-log10 p) are calculated by hypergeometric test. C GSEA enrichment scores of PI3K-AKT-mTOR, P53, G2M Checkpoint, and E2F targets pathways in TFE3-tRCC versus normal tissues. D Unsupervised clustering of samples from the TCGA RCC and our TFE3-tRCC cohorts (n = 63) using ssGSEA scores from 25 immune cell types, IIS and TIS. KICH (n = 65), KIRC (n = 539), KIRP (n = 289). E Comparing the expression of 25 immune cell types, IIS and TIS between TCGA-KIRC (n = 539) and our TFE3-tRCC cohorts (n = 63). (F) Bar chart depicts the prevalence of CD8 expression by immunohistochemistry. G Representative immunofluorescence demonstrating the presence of overall CD8 + T-cell, tumor-associated macrophage (CD68 and HLA-DR), and NK cell (CD56) infiltration in three selected samples (TFE3-32, TFE3-38, and TFE3-37) in our cohort. Ten random high-power fields of tumor parenchyma were checked for CD8, CD68, HLA-DR, and CD56 positive expression. Magnification × 400. Scale bar = 100 μm. H Bar chart depicts the prevalence of PD-L1 expression by immunohistochemistry. P-values were determined by Pearson’s chi-square test. I) Heatmap shows the immune features among TFE3-tRCCs (n = 63). Each column represents an individual tumor. Patients were separated into eight groups: those with ASPSCR1-TFE3 (n = 13), with SFPQ-TFE3 (n = 15), with NONO-TFE3 (n = 8), with MED15-TFE3 (n = 8), with PRCC-TFE3 (n = 6), with RBM10-TFE3 fusions (n = 4), with rare TFE3-associated gene fusions (n = 3, including FUBP1-TFE3, SETD1B-TFE3, and ZC3H4-TFE3), and unknow partners (n = 6). The top panel shows fusion partners and isoforms. The bottom panel shows immune features, including TIS, IIS, PD-L, CD8, and TIME type. TFE3-tRCC TFE3-translocation renal cell carcinoma, TCGA The Cancer Genome Atlas. KICH chromophobe renal cell carcinoma, KIRC renal clear cell carcinoma, KIRP renal papillary cell carcinoma, IIS immune infiltration score, TIS T-cell infiltration score, IHC immunohistochemistry, TIME tumor immune microenvironment.
Next, we explored the tumor immune microenvironment (TIME) in TFE3-tRCC. We found a lower immune infiltration score (IIS) and T-cell infiltration score (TIS) in TFE3-tRCC in contrast to KIRC from the TCGA cohort (Fig. 4D and Supplementary Figure 8B). Using a refined RCC immune cell gene-specific signatures18, we found that compared with TCGA RCC subtypes, the T helper 2 cell (Th2) signature was increased in TFE3-tRCC, while the activated dendritic cell (aDC) and plasmacytoid dendritic cell (pDC) signatures had decreased expression (Fig. 4E and Supplementary Figure 8B). Moreover, the natural killer cell (NK) signature was increased in most TFE3-tRCC compared with KIRP and KICH. Furthermore, lower levels of CD8 + T-cell, T-cell, and macrophage signatures were identified in TFE3-tRCC relative to KIRC (Fig. 4E). Consistently, immunohistochemistry (IHC) confirmed that two-thirds (74.6%, 47/63) of tumors had low CD8 + T-cells infiltrations, while only twenty percent (20.6%, 13/63) of tumors showed massive CD8 + T cells infiltrations (Fig. 4F and Supplementary Figure 9). In tumors with a low CD8 + T-cells infiltrations, multiple immunofluorescence further revealed a low infiltration of NK (CD56 + ) cells and macrophages (CD68 + /HLA-DR + ) in the tumor stroma (Fig. 4G). In line with a previous analysis13, the expression of PD-L1 mRNA was higher in TFE3-tRCC than KIRC and KIRP in our analysis (Supplementary Figure 8 C). However, different from the RNA-seq results, there was a relatively low PD-L1 positivity rate (17.5%, 11/63) in our TFE3-tRCC cohort as assessed via PD-L1 IHC staining. Interestingly, we observed higher expression of PD-L1 mRNA and protein levels in tumors with MED15-TFE3 fusion (Fig. 4H and Supplementary Figure 8D). Apart from MED15-TFE3 fusion tRCC, nearly two-thirds (63.5%, 40/63) of TFE3-tRCCs in our cohort exhibited type 1 TIME19, characterized by a low CD8 + T-cells infiltration and low PD-L1 expression in tumors (Fig. 4I). Taken together, our data demonstrated an immunologically ignorant microenvironment in TFE3-tRCC.
Identification and characterization of five molecular subtypes of TFE3-tRCC
To move forward on understanding the biology of TFE3-tRCC, we performed unsupervised clustering analysis using NMF to identify and refine transcription-based subgroups of patients with common TFE3-tRCC subtypes (n = 54). Consequently, five distinct clusters were identified based on the 1500 most variable genes in our TFE3-tRCC cohort (Fig. 5A). To further reveal the transcriptional features driving these clusters, we performed quantitative set analyses for gene expression (QuSAGE)20 to compare each cluster with all others utilizing Hallmark gene sets (Fig. 5B and Supplementary Data 6). Combining this with the results of DEG analysis, which also compared clusters individually to others, we summarized and refined four signatures of representative genes involving stroma, angiogenesis, proliferation and KRAS down (Fig. 5C). Tumors in cluster 5 were characterized as highly angiogenic and proliferative, which showed high expression of angiogenesis-related genes (e.g., VEGFA, POSTN and HIF1A) and had enrichment of cell-cycle transcriptional programs (E2F targets, G2M checkpoint, and p53). Compared with tumors in the other clusters, tumors in cluster 5 had higher angiogenesis scores (Fig. 5D). IHC further confirmed that these tumors had the strongest nuclear HIF1A staining and increased vessel density (Fig. 5E). Moreover, tumors in cluster 5 also exhibited higher expression of stroma signature, exemplified by significantly higher epithelial-mesenchymal transition (EMT) score, and a high degree of collagens and activated stroma-related genes (e.g., FAP, CDH2, and CDH6; Fig. 5C and D). Cluster 1 was characterized by moderate enrichment of EMT, apical junction, TGF-β, WNT catenin, and hypoxia signaling, which have been associated with stroma and angiogenesis signatures (Fig. 5B). Tumors in cluster 3 and 4 were featured by low expression of angiogenesis modules (Fig. 5B–D). In contrast to cluster 3, cluster 4 showed moderate enrichment of E2F signaling. Cluster 2 differentiated from the other clusters by enrichment of genes repressed by KRAS down signature (Fig. 5B and C).
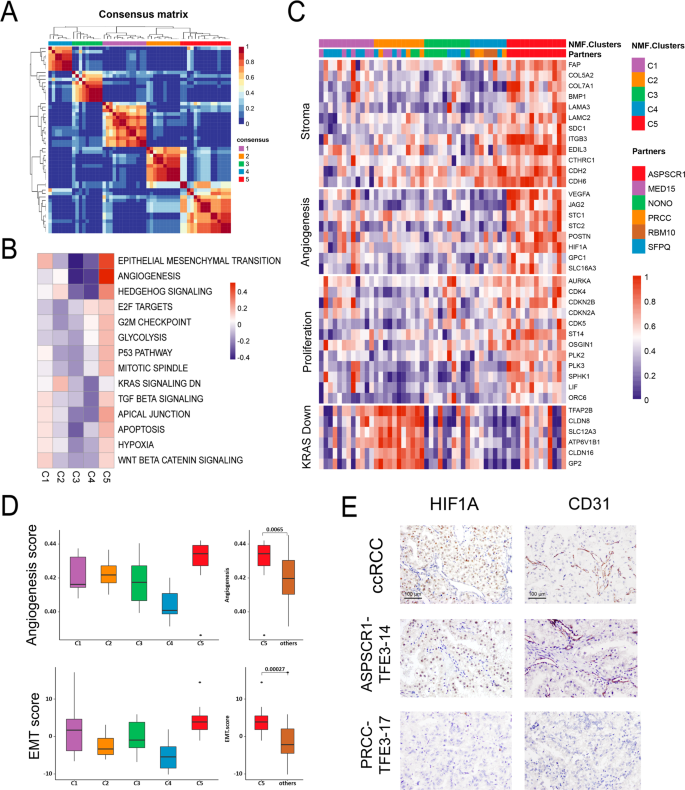
A Consensus matrix depicting clusters (k = 5) identified by NMF clustering of tumors with definite fusion partners (n = 54). B Heatmap representing MSigDb hallmark gene set QuSAGE enrichment scores for each NMF tumor cluster compared with all other tumors. White cells represent non-significant enrichment after FDR correction. C Heatmap of genes comprised in transcriptional signatures. Samples are grouped by NMF cluster. D Comparative angiogenesis score (top) and EMT score (bottom) in samples between the different NMF tumor clusters (C1–C5). C1, n = 12; C2, n = 11; C3, n = 10; C4, n = 8; C5, n = 13; others = C1 + C2 + C3 + C4, n = 41. Box plots show median levels (middle line), 25th and 75th percentile (box), 1.5 times the interquartile range (whiskers) as well as outliers (single points). P values were determined by the two-sides Mann–Whitney U test. E Representative IHC demonstrating HIF1A and CD31 expression in two selected samples (TFE3-14 and TFE3-17) in our cohort and one positive control (ccRCC with VHL mutant). Five random high-power fields were checked for HIFA and CD31 positive expression. Magnification × 200. Scale bar = 100 μm. TFE3-tRCC TFE3-translocation renal cell carcinoma, NMF non-negative matrix factorization, EMT epithelial-mesenchymal transition, IHC immunohistochemistry.
TFE3-tRCC molecular subtypes associate with patient prognosis and efficacy to systematic treatment
Remarkably, we demonstrated that this molecular classification was associated with fusion subtypes and patient outcomes (Supplementary Figure 10). All tumors with ASPSCR1-TFE3 fusion were classified into the high angiogenesis/stroma/proliferation cluster (cluster 5), which exhibited worse survival. Cluster 1 included a half of MED15-TFE3 (62.5%, 5/8) and SFPQ-TFE3 (46.7%, 7/15) fusion tRCCs and cluster 3 was mainly comprised of NONO-TFE3 (75%, 6/8) and SFPQ-TFE3 (26.7%, 4/15) fusion tRCCs. Both the clusters showed moderate EMT score and intermediate survival (Fig. 5D). Although cluster 2 and cluster 4 consisted of mixed fusion subtypes, tumors in these clusters showed decreased EMT score, and demonstrated more favorable prognosis.
A total of eight patients received systematic therapy in our TFE3-tRCC cohort. Of note, the median progression-free survival (PFS) for patients receiving first-line tyrosine kinase inhibitors (TKIs) treatment was only 3 months (Fig. 6A), confirming that the low angiogenesis signature interfered with the efficacy of TKIs monotherapy for patients with TFE3-tRCC. Interestingly, we observed two patients in cluster 5 had sustained control of disease to TKIs plus immune checkpoint inhibitors, with one (TFE3-68) showing partial response (tumor shrinkage 63.1%) after 5 months of first-line axitinib plus pembrolizumab and the other patient (TFE3-65) demonstrating stable disease for 12 months after third-line axitinib plus pembrolizumab (Fig. 6B). These initial clinical results indicated that tumors in cluster 5 might have a higher likelihood of response to antiangiogenic plus immunotherapy.

A Swimmer plot depicts the PFS of individual patients receiving first-line TKIs treatments. Vertical line indicates PFS at 3 months. B Baseline imaging in two patients (TFE3-68 and TFE3-65) before initiation of systematic treatment and after they received the combination of pembrolizumab plus axitinib treatment. TFE3-tRCC TFE3-translocation renal cell carcinoma, TKIs tyrosine kinase inhibitor, PFS progression-free survival. Arrow indicates tumor lesion.
Discussion
This study depicted comprehensive molecular analyses of 63 untreated primary TFE3-tRCCs and investigated the molecular characteristics of this rare but highly heterogeneous RCC entity. Our findings provided important new insights into key genomic and biologic features underlying TFE3-tRCC development and progression, confirmed the promotion role of copy number alterations in tumor progression, revealed the prognostic value of TFE3 fusion patterns, and described five distinct molecular clusters associated with different transcriptional signatures.
We identified a low degree of somatic mutation rate but a widespread existence of SCNAs in TFE3-tRCC. Copy number alterations in TFE3-tRCC have been previously explored but with inconsistent results. In a previous study of 16 tRCCs, 17q gain (44%) was identified as the most common SCNA and found to be a predictor for poor prognosis11. More recently, a genomic analysis of 22 tRCCs reported loss of 9p (41%) and gain of 17q (36%) were the most frequent SCNAs, but no single SCNA event was associated with worse prognosis13. Such inconsistent results may result from the relatively small sample sizes and heterogeneity of TFE3-tRCC, since both studies only included a few TFE3-tRCC subtypes and were confounded with TFEB-tRCC samples. In our cohort, gain of 17q and loss of 9p were found in 23 and 11% of TFE3-tRCC, respectively. Loss of chromosome arm 9p but not gain of arm 17q was correlated with poor survival. In addition, loss of 1p, 2p, 6q, 8p, 22q, and increased SCNA burden were also predictors for poor prognosis. More importantly, we demonstrated that 22q loss was significantly associated with aggressive clinical features and an independent predictor of worse outcomes for patients with TFE3-tRCC. Increased loss of chromosome 22q that encodes NF2, CHEK2, and SMARCB121 were observed in type 2 PRCC, which may implicate in carcinogenesis and tumor progression. A recent study suggested that the presence of copy number variations might be an earlier event in TFE3-tRCC than somatic mutations13. Therefore, our results again underscore the importance of SCNA in the aggressive characteristics of TFE3-tRCC and the prognostic value of copy number aberrations.
Our results demonstrated an immune ignorant TIME in the majority of TFE3-tRCCs, characterized by low PD-L1 expression and low CD8 + T-cell infiltration in tumor stroma. Except for tumors with MED15-TFE3 fusion, a low PD-L1 positivity rate was detected in our TFE3-tRCCs. Therefore, it is possible that the fusion subtype may impact the different PD-L1 expression in TFE3-tRCC. Given the low immunogenicity of TFE3-tRCC (mostly belonging to TIME type 1), single-agent PD-1/PD-L1 blockade could probably be inadequate to improve outcomes in those with advanced disease, which is supported by several clinical investigations22,23,24. Therefore, combination therapeutic regimens, including radiotherapy, targeted therapy, or chemotherapy plus immunotherapy, could be more effective to mediate immunogenic cell death though inducing neoantigen liberation and lymphocytes recruitment into the tumor microenvironment25.
TFE3-tRCC represents a heterogeneous disease with a wide spectrum of morphologies and varied clinical phenotypes. Several studies suggested that patients with different fusion subtypes exhibited differential prognosis2. In this study, we explored the association between fusion subtypes and patient outcomes. We observed that tumors with ASPSCR1-TFE3 fusion had much worse survival compared to those with other fusions. On the contrary, patients with other common TFE3 fusions, including MED15-TFE3 and PRCC-TFE3 showed a better prognosis. Our findings highlighted the importance of the detection of TFE3 fusion partners for predicting prognosis. Also, the detailed mechanisms of TFE3 fusion partners in regulating the chimeric protein are intriguing and warrant further investigation.
Our unsupervised transcriptomic analysis identified five molecular clusters. Tumors with ASPSCR1-TFE3 fusion were exclusively classified into cluster 5, exhibiting high expression of angiogenesis/stroma/proliferation gene signatures. The distinct genomic features of ASPSCR1-TFE3 fusion tRCC identified in the current study suggested a molecular basis for the aggressive nature of this TFE3-tRCC subtype. A preclinical study suggested that ASPSCR1-TFE3 fusion induced accumulation of lactate in tumor microenvironment, leading to tumor hypoxia and angiogenesis in alveolar soft part sarcoma26. In agreement with this finding, we found that tumors with ASPSCR1-TFE3 fusion exhibited strong nuclear HIF1A staining and increased vessel density. Thus, patients with ASPSCR1-TFE3 fusion tRCC may benefit from antiangiogenic based treatment. It is important to note that the high stroma and proliferation signatures may also interfere with the efficacy of antiangiogenic monotherapy. Interestingly, we observed a favorable response to anti-PD1 plus TKI combination therapy in two ASPSCR1-TFE3 fusion tRCC patients in this study. Therefore, our data may support clinical investigation of antiangiogenic therapy in combination with immune checkpoint inhibitors in this TFE3-tRCC subtype.
In contrast to ASPSCR1-TFE3 fusion tRCC, other relatively common TFE3-tRCC fusion subtypes were characterized by decreased angiogenesis gene signatures. These findings provide a molecular explanation for the unfavorable clinical outcome to antiangiogenic monotherapy in ours and previous clinical studies27,28. Tumors in cluster 1 and 3 were associated with moderate stroma signatures. Tumors in cluster 2 and 4 showed an enrichment of KRAS down signature and E2F pathway, respectively. In addition, both ours and previous studies showed the activation of autophagy, mTOR and proliferation signaling in the whole TFE3-tRCC28,29,30. Therefore, targeting these specific aberrations, such as stromal disruptors, E2F, autophagy, mTOR, and proliferation inhibitors may be options for patients with advanced TFE3-tRCCs.
The current study is not devoid of limitations. Due to the low incidence of TFE3-tRCC and its high heterogeneity, it is difficult to collect an adequate number of cases with different subtypes for further analysis. However, our study represents the largest cohort to date investigating the molecular features of TFE3-tRCC. Additionally, this was a single-center study thus selection bias is unavoidable. Although with a relatively long follow-up time, we acknowledge that the low proportion of death cases may restrict the statistical power of survival analysis in our study. Future multicenter studies with larger sizes are needed to shed further light on the molecular mechanisms of TFE3-tRCC.
Overall, the current study expanded our knowledge of the genomic and transcriptional landscape of TFE3-tRCC, emphasized the importance of fusion partners and structures for patient outcomes, and provided a molecular basis for the heterogeneous clinical phenotype. Our study represented a step forward in understanding the TFE3-tRCC biology. We expect that our findings will provide a genetic basis for developing personalized therapies for this disease.
Methods
Patient identification
A total of 4581 cases diagnosed as RCC who underwent surgery for the kidney at our center between 2009 and 2019 were reviewed by two experienced uropathologists (Ni Chen and Mengni Zhang). Among them, 1006 suspicious non-clear cell RCC cases were identified via morphological evaluation and were selected for further TFE3 IHC. As a result, 68 TFE3 positive cases were confirmed as TFE3-tRCC by break-apart fluorescence in situ hybridization (FISH) assay (Supplementary Figure 1). Untreated primary tumor tissues and adjacent normal samples were collected. RNA-seq and WES of formalin-fixed paraffin-embedded (FFPE) tissues were subsequently performed. RNA-seq was performed on 63 tumors and adjacent normal tissues. WES was performed on 53 FFPE tumor tissues and matched adjacent normal (n = 42)/blood (n = 11) samples. The study was conducted in accordance with the Declaration of Helsinki and was approved by the Ethics Committee of West China Hospital of Sichuan University. All patients or family members provided written consent for genetic analysis.
Clinicopathological characteristics and outcomes
Clinicopathological data were retrospectively collected, including age, gender, tumor size, TNM stage, morphological features, ISUP grade, and systemic treatment strategies. For patients with localized disease, regular evaluations were performed every 6–12 months postsurgery. For those with metastatic disease, regular evaluations were carried out every 4–6 weeks after receiving systematic therapy. For patients receiving systemic treatments, PFS was defined as the time from treatment initiation to disease progression or death. Tumor response was defined by Response Evaluation Criteria in Solid Tumors (RECIST) version 1.131. OS was defined as the time from surgery to the date of death.
IHC and multiple immunofluorescence
IHC and multiple immunofluorescence were performed as previously described32. Commercially available primary anti-TFE3 (clone MRQ-37, 1:100, MXB biotechnologies, Fujian, China), anti-HIF1A (1:5000, Novus Biologicals, Colorado, USA), anti-CD31 (clone UMAB30, ready to use, ZSGB-BIO, Beijing, ChinaMXB), CD8 (clone C8/144B, ready to use, Dako, Copenhagen, DEN) and PD-L1 (clone 22C3, 1:50, Dako) were used in this study. Multiplex immunofluorescence staining was performed with a PANO 7-plex kit (0004100100, Panovue, Beijing, CHN). CD8, macrophage, and NK cells expression were quantified as positive cell density (cell number per mm2). PD-L1 expression was assessed by tumor proportion score, which was defined as the percentage of tumor cells with membranous PD-L1 staining. PD-L1 expression >1% was defined as positivity.
Fluorescence in situ hybridization assay
FFPE tissue sections were examined by using interphase FISH to investigate the rearrangement of the TFE3 region with an LSI dual-color break-apart probe (GSP TFE3, Anbiping company, Guangzhou, China). TFE3 gene rearrangement would result in break-apart of the normal fused green-red signals, resulting in one green/one red break-apart signal pattern (male), or one green/one red break-apart signal and one remaining normal fused green-red signal pattern (female) in a normal cell. One hundred nonoverlapping tumor nuclei were evaluated. The cut-off value was 10%33.
Fusion validation by RT-PCR
cDNA was synthesized using PrimeScriptTM RT Master Mix (RR036A, Takara, Shiga, Japan) according to the manufacture’s instruction and then subjected to PCR reactions. Primer sequences for fusion validations are listed in Supplementary Table 5. PCR was performed with the following thermal cycling conditions: a 98 °C for 10 s; 35 cycles of 95 °C for 10 s, 52 °C for 30 s and 72 °C for 1 min; and a 72 °C for 5 min. PCR products were separated by electrophoresis in agarose gels, purified with ChargeSwitch™ PCR Clean-Up Kit (CS12000, Invitrogen, Oberhausen, GER) and then sequenced by ABI 3730XL automatic sequencer (Life Technologies).
Total RNA isolation, library preparation, and sequencing
Total RNA was isolated from each sample (63 tumor samples and 14 paired adjacent normal samples) using the Qiagen RNeasy formalin-fixed paraffin-embedded (FFPE) Kit (73504, Qiagen, Hilden, Germany), following the protocol from the manufacturer. The purity and quantity of total RNA were measured by Nanodrop. The integrity of RNA was evaluated using the RNA Nano6000 Assay Kit on the Bioanalyzer 2100 system (Agilent Technologies, CA, USA). 1 μg RNA of per sample was used as input for the RNA sample preparations. Strand-specific RNA sequencing libraries were generated using the Whole RNA-seq Lib Prep kit for Illumina (RK20303, ABclonal, Shanghai, China). Library quality was evaluated on the Agilent Bioanalyzer 2100 system (Agilent, USA). Final libraries were sequenced at the Novogene Bioinformatics Institute (Beijing, China) on an Illumina Hiseq X10 platform by 150 bp paired-end reads.
Gene expression quantification and fusion detection
The raw RNA-sequencing reads were filtered by FastQC, Reads were aligned using STAR (v2.7.0 f)34 with default parameters to the Ensembl human genome assembly GRCh37. Gene expression levels were estimated by raw count and Transcripts Per Kilobase Million (TPM). Annotations of mRNA in the human genome were retrieved from the GENCODE (v19) database. Paired trimmed/clipped and de-duplicated RNAseq reads were used to identify gene fusion events, and the aligned output was used as input to STAR-Fusion (v1.9.1) using the developer-supplied gencode v33 CTAT library from April 6, 2020. Fusion gene supported by at least two reads were selected.
Analysis of differentially expressed genes (DEG) and enrichment of signaling pathways
DEGs were determined using the R package “limma” with cut-off P value < 0.0535. Upregulated genes and downregulated genes were used to perform ontology and pathway enrichment analysis based on Gene Ontology and KEGG databases using R package “ClusterProfiler”36.
Gene set enrichment analysis
DEG analysis results were used in GSEA analyses. For gene set analysis, hallmark gene sets from Msigdb database37 were collected. The top 1500 DEGs were chosen by P value ranked by log2 fold change, and then fed into “fgsea” R packages38.
Non-negative matrix factorization clustering
We selected 1500 genes with the highest variability across tumors, using Median Absolute Deviation (MAD) analysis. Subclasses were then computed after reducing the dimensionality of the expression data from thousands of genes to a few metagenes using consensus NMF clustering. This method computes multiple k-factor factorization decompositions of the expression matrix, and evaluates the stability of the clustering result using the cophenetic coefficient index. The robust consensus NMF clustering of 54 patient tumors using the top 1500 variable genes, and k = 5 was identified through testing k = 2 to k = 10.
Gene signatures
Marker genes for renal cell carcinoma immune cell types were obtained from Wang et al18. The T-cell infiltration score (TIS) was defined as the mean of the standardized values for nine T-cell subtypes, and the immune infiltration score (IIS) for a sample was similarly defined as the mean of the standardized values for innate and adaptive immune scores39. A previously published angiogenesis signature was utilized to measure an angiogenesis score40. And epithelial-mesenchymal transition (EMT) score was calculated following the method mentioned in Gibbons et al.41.
Implementation of single-sample gene set enrichment analysis (ssGSEA)
ssGSEA was used for quantifying immune infiltration and activity in tumors using markers reported by Wang et al18. The ssGSEA method is an extension of the GSEA42 method, which works at a single-sample level rather than a sample population. Normalized RNA-Seq data were used as input without further processing (i.e., no standardization or log transformation).
Quantitative set analysis for gene expression (QuSAGE)
To reveal latent biological pathways of NMF clustering, we conducted QuSAGE (R qusage v2.20.0) to compare each cluster to all others, leveraging MSigDb hallmark gene sets to identify enriched pathways within each cluster.
DNA extraction
Representative sections of formalin-fixed paraffin-embedded (FFPE) tumor (n = 53) and matched normal tissues (n = 42) or blood samples (n = 11) were collected. Tumor sections were reviewed by a pathologist to ensure tumor sections with >70% tumors and <10% necrosis. High-quality genomic DNA was extracted by using the GeneRead DNA FFPE Kit (180134, QIAGEN, Hilden, GER) according to the manufacturer’s instructions. Germline DNA (gDNA) was extracted from white blood cells using the Blood Genomic DNA Mini Kit (CW2087, Cwbiotech, Beijing, China).
Whole-exome sequencing
WES was used to determine the mutational landscape of TFE3-tRCC. Exome capture was performed using the Agilent SureSelect Human All ExonV5 kit (Technologies, CA, USA) according to the manufacturer’s instructions. This was followed by paired-end sequencing using Illumina Novaseq6000 sequencer (Illumine Inc, CA, USA). Mean clean sequence data obtained was 38.30 Gb for tumor samples and 14.95 Gb for normal tissue/blood samples. Details of somatic and germline mutation analysis are described below.
Read alignment and BAM file generation
Clean reads were aligned to the reference human genome hg19 (Genome Reference Consortium GRCh37) using the BWA (v0.7.17) (Burrows-Wheeler Aligner) MEM algorithm with default parameters. BAM was coordinate sorted and PCR duplicates were removed with Sambamba (v0.6.8).
Postalignment optimization
After the initial alignment of WES data, we followed GATK (v3.8) Best Practice to process all BAMs from the same patient together for a postalignment optimization process called “co-cleaning” which includes GATK IndelRealigner and BaseQualityScoreRecalibration (BQSR). IndelRealigner performed local realignment to further improve mapping quality across all reads at loci close to indels, and BQSR detected and fixed systematic errors made by the sequencer when it estimated the quality score of each base call43,44,45.
Somatic mutations analysis
The GATK MuTect2 pipeline was run for paired tumor-normal somatic mutation calling with gnomAD database and a panel of normal made from all normal samples to filter common germline mutations and recurrent technical artifacts. The resulting VCFs were filtered by Mutect2 FilterMutectCalls module, variants outside of the capture kit were removed, and FilterByOrientationBias module was used to filter out false-positive calls from OxoG and FFPE. The resulting somatic SNVs and indels were further filtered according to the flowing criteria46,47,48,49: read depth ≥10 in both tumor and normal samples, mapping quality ≥40 and base quality ≥20, variants allele frequency (VAF) ≥ 5% and supporting reads ≥5 in tumor, VAF in tumor was ≥5 times than that of the matched normal VAF. Variants were annotated with Oncotator v1.9.9.0. To further avoid miscalling germline variants at least 19 read depth in the normal sample in dbSNP sites. Variants were excluded with minor allele frequency (MAF) > 0.01 in public databases, including 1000 G (May 2013), Exome Sequencing Project (ESP6500) and Exome Aggregation Consortium (ExAC v0.3.1). Variants were filtered which annotated as 3’UTR, 5’UTR, 3’Flank, 5’Flank, IGR, Intron, lincRNA, Silent RNA.
Somatic mutation signature profiling
The R package MutationalPatterns50 (v3.0.1) was used to extract the somatic motifs of these samples. In brief, the somatic motifs for each variant were retrieved from the reference sequence and converted into a matrix. NMF was used to estimate the optimal number of mutation signatures extracted from WES samples. Cosine similarity was calculated to measure the similarity between our identified signatures and COSMIC signatures v3.2 [cancer.sanger.ac.uk/cosmic/signatures].
Somatic copy number alterations analysis
FACETS (v0.5.14)51 was used to estimate tumor cellularity and ploidy from paired tumor and normal WES data, and calculated allele-specific somatic copy number alterations. Copy Number (CN) gains were defined as alterations showing total CN > 2 and CN losses were defined as alterations showing total CN < 2. Arm-level events were defined as any gain or loss occurring in an autosome that involved at least 10% of the arm. To identify significantly focal SCNAs, we used GISTIC2 (v2.0.23)52, which considers both the frequency and amplitude of every SCNA, was employed with the following modified parameters “-smallmem 1 -broad 1 -brlen 0.7 -cap 1.5 -conf 0.99 -ta 0.2 -td 0.25—armpeel 1 -genegistic 1 -savegene 1 -gcm extreme -js 4 -maxseg 2000 -qvt 0.25 -rx 0”. CN gains were defined as alterations showing 0.1 < log2 CN ratio < 0.7 and CN losses were defined as alterations showing −1.1 < log2 CN ratio < −0.1. To measure SCNA burden, fraction of copy number-altered genome (FCA) was calculated by dividing the number of bases in segments with mean log2 CN ratio >0.1 or < −0.1 by the number of bases in all segments. SCNA burden high was defined as ≥ 75th of percentile of SCNA burden in the relevant cohort. SCNA burden low was defined as < 75th of percentile of SCNA burden.
Tumor suppressor gene screening
Tumor suppressor genes (TSGs) were obtained from TSGene version 2.0 (https://bioinfo.uth.edu/TSGene/) and IntOGen (https://www.intogen.org) database. Genes mutated in at least two samples were shown in barplot and TSGs were marked with bold font. KEGG enrichment analysis was done with those genes. Clonality of mutations was determined based on the cancer cell fraction (CCF) estimated by allele-specific copy number analysis.
Statistics
All analyses were conducted using R software (v3.6.0) and SPSS (v16.0). All comparisons for continuous variables were performed using the two-sided Mann–Whitney U test for two groups. For categorical variables, Pearson’s Chi-squared test with continuity correction or Fisher’s exact test was used. Survival analyses were conducted using Kaplan–Meier method and the difference was tested using log-rank. Cox proportional hazards regression (forward likelihood ratio model) was used to determine the independent predictor of OS. All clinicopathological parameters and biomarkers at P < 0.05 were then further tested on multivariate Cox regression in three patient cohorts (WES + RNAseq cohort, WES cohort and RNAseq cohort). Least absolute shrinkage and selection operator Cox regression were also performed using all variables in the multivariate analyses to identify optimal predictors of OS. A P value less than 0.05 was considered statistically significant.
Reporting Summary
Further information on research design is available in the Nature Research Reporting Summary linked to this article.
Data availability
The WES data generated in this study have been deposited in NODE (The National Omics Data Encyclopedia) database (https://www.biosino.org/node/project/detail/OEP002535, accession numbers OEP002535) and the NCBI Sequence Read Archive (SRA) database (https://www.ncbi.nlm.nih.gov/biosample/SAMN20702299, accession numbers SAMN20702299). The gene expression data reported in this paper were deposited in the Gene Expression Omnibus (GEO) database (https://www.ncbi.nlm.nih.gov/geo/query/acc.cgi?acc=GSE167573, accession numbers GSE167573). The transcriptome data of TCGA-KIRC, KIRP and KICH were collected from the following web-links https://portal.gdc.cancer.gov/projects/TCGA-KIRC, https://portal.gdc.cancer.gov/projects/TCGA-KIRP and https://portal.gdc.cancer.gov/projects/TCGA-KICH, respectively. The remaining data are available within the Supplementary Information.
References
Classe, M. et al. Incidence, clinicopathological features and fusion transcript landscape of translocation renal cell carcinomas. Histopathology. 70, 1089–1097 (2017).
Ellis, C. L. et al. Clinical heterogeneity of Xp11 translocation renal cell carcinoma: impact of fusion subtype, age, and stage. Mod. Pathol. 27, 875–886 (2014).
Sukov, W. R. et al. TFE3 rearrangements in adult renal cell carcinoma: clinical and pathologic features with outcome in a large series of consecutively treated patients. Am. J. Surg. Pathol. 36, 663–670 (2012).
Skala, S. L. et al. Detection of 6 TFEB-amplified renal cell carcinomas and 25 renal cell carcinomas with MITF translocations: systematic morphologic analysis of 85 cases evaluated by clinical TFE3 and TFEB FISH assays. Mod. Pathol. 31, 179–197 (2018).
Pan, C. C., Sung, M. T., Huang, H. Y. & Yeh, K. T. High chromosomal copy number alterations in Xp11 translocation renal cell carcinomas detected by array comparative genomic hybridization are associated with aggressive behavior. Am. J. Surg. Pathol. 37, 1116–1119 (2013).
Komai, Y. et al. Adult Xp11 translocation renal cell carcinoma diagnosed by cytogenetics and immunohistochemistry. Clin. Cancer Res. 15, 1170–1176 (2009).
Zhong, M. et al. Translocation renal cell carcinomas in adults: a single-institution experience. Am. J. Surg. Pathol. 36, 654–662 (2012).
Bruder, E. et al. Morphologic and molecular characterization of renal cell carcinoma in children and young adults. Am. J. Surg. Pathol. 28, 1117–1132 (2004).
Ramphal, R., Pappo, A., Zielenska, M., Grant, R. & Ngan, B. Y. Pediatric renal cell carcinoma: clinical, pathologic, and molecular abnormalities associated with the members of the mit transcription factor family. Am. J. Clin. Pathol. 126, 349–364 (2006).
Kauffman, E. C. et al. Molecular genetics and cellular features of TFE3 and TFEB fusion kidney cancers. Nat. Rev. Urol. 11, 465–475 (2014).
Malouf, G. G. et al. Genomic heterogeneity of translocation renal cell carcinoma. Clin. Cancer Res. 19, 4673–4684 (2013).
Malouf, G. G. et al. Next-generation sequencing of translocation renal cell carcinoma reveals novel RNA splicing partners and frequent mutations of chromatin-remodeling genes. Clin. Cancer Res. 20, 4129–4140 (2014).
Marcon, J. et al. Comprehensive genomic analysis of translocation renal cell carcinoma reveals copy-number variations as drivers of disease progression. Clin. Cancer Res. 26, 3629–3640 (2020).
Chen, F. et al. Multilevel genomics-based taxonomy of renal cell carcinoma. Cell Rep. 14, 2476–2489 (2016).
Alexandrov, L. B. et al. The repertoire of mutational signatures in human cancer. Nature. 578, 94–101 (2020).
Baba, M. et al. TFE3Xp11.2 translocation renal cell carcinoma mouse model reveals novel therapeutic targets and identifies GPNMB as a diagnostic marker for human disease. Mol. Cancer Res. 17, 1613–1626 (2019).
Durinck, S. et al. Spectrum of diverse genomic alterations define non-clear cell renal carcinoma subtypes. Nat. Genet. 47, 13–21 (2015).
Wang, T. et al. An empirical approach leveraging tumorgrafts to dissect the tumor microenvironment in renal cell carcinoma identifies missing link to prognostic inflammatory factors. Cancer Disco. 8, 1142–1155 (2018).
Sanmamed, M. F. & Chen, L. A paradigm shift in cancer immunotherapy: from enhancement to normalization. Cell. 175, 313–326 (2018).
Yaari, G., Bolen, C. R., Thakar, J. & Kleinstein, S. H. Quantitative set analysis for gene expression: a method to quantify gene set differential expression including gene-gene correlations. Nucleic Acids Res. 41, e170 (2013).
Ricketts, C. J. et al. The cancer genome atlas comprehensive molecular characterization of renal cell carcinoma. Cell Rep. 23, 313–326 e315 (2018).
Boileve, A. et al. Immune checkpoint inhibitors in MITF family translocation renal cell carcinomas and genetic correlates of exceptional responders. J. Immunother. Cancer. 6, 159 (2018).
Chahoud, J. et al. Nivolumab for the treatment of patients with metastatic non-clear cell renal cell carcinoma (nccRCC): a single-institutional experience and literature meta-analysis. Oncologist. 25, 252–258 (2019).
McKay, R. R. et al. The clinical activity of PD-1/PD-L1 inhibitors in metastatic non-clear cell renal cell carcinoma. Cancer Immunol. Res. 6, 758–765 (2018).
Chen, Y. P. et al. Genomic analysis of tumor microenvironment immune types across 14 solid cancer types: immunotherapeutic implications. Theranostics. 7, 3585–3594 (2017).
Goodwin, M. L. et al. Modeling alveolar soft part sarcomagenesis in the mouse: a role for lactate in the tumor microenvironment. Cancer Cell. 26, 851–862 (2014).
Choueiri, T. K. et al. Vascular endothelial growth factor-targeted therapy for the treatment of adult metastaticXp11.2 translocation renal cell carcinoma. Cancer. 116, 5219–5225 (2010).
Motzer, R. J. et al. Molecular subsets in renal cancer determine outcome to checkpoint and angiogenesis blockade. Cancer Cell. 38, 803–817 (2020).
Damayanti, N. P. et al. Therapeutic targeting of TFE3/IRS-1/PI3K/mTOR axis in translocation renal cell carcinoma. Clin. Cancer Res. 24, 5977–5989 (2018).
Wang B, et al. PRCC-TFE3 fusion-mediated PRKN/parkin-dependent mitophagy promotes cell survival and proliferation in PRCC-TFE3 translocation renal cell carcinoma. Autophagy. 1–19 (2020).
Eisenhauer, E. A. et al. New response evaluation criteria in solid tumours: revised RECIST guideline (version 1.1). Eur. J. Cancer. 45, 228–247 (2009).
Sun, G. et al. Integrated molecular characterization of fumarate hydratase-deficient renal cell carcinoma. Clin. Cancer Res. 27, 1734–1743 (2021).
Song, Y. et al. Xp11 translocation renal cell carcinoma with morphological features mimicking multilocular cystic renal neoplasm of low malignant potential: a series of six cases with molecular analysis. J. Clin. Pathol. 74, 171–176 (2020).
Dobin, A. et al. STAR: ultrafast universal RNA-seq aligner. Bioinforma. 29, 15–21 (2013).
Ritchie, M. E. et al.limma powers differential expression analyses for RNA-sequencing and microarray studies. Nucleic Acids Res. 43, e47 (2015).
Yu, G., Wang, L. G., Han, Y. & He, Q. Y. clusterProfiler: an R package for comparing biological themes among gene clusters. OMICS. 16, 284–287 (2012).
Liberzon, A. et al. Molecular signatures database (MSigDB) 3.0. Bioinforma. 27, 1739–1740 (2011).
Sergushichev A. An algorithm for fast preranked gene set enrichment analysis using cumulative statistic calculation. BioRxiv. 060012 (2016).
Senbabaoglu, Y. et al. Tumor immune microenvironment characterization in clear cell renal cell carcinoma identifies prognostic and immunotherapeutically relevant messenger RNA signatures. Genome Biol. 17, 231 (2016).
McDermott, D. F. et al. Clinical activity and molecular correlates of response to atezolizumab alone or in combination with bevacizumab versus sunitinib in renal cell carcinoma. Nat. Med. 24, 749–757 (2018).
Gibbons, D. L. & Creighton, C. J. Pan-cancer survey of epithelial-mesenchymal transition markers across the Cancer Genome Atlas. Dev. Dyn. 247, 555–564 (2018).
Subramanian, A. et al. Gene set enrichment analysis: a knowledge-based approach for interpreting genome-wide expression profiles. Proc. Natl Acad. Sci. USA. 102, 15545–15550 (2005).
VdA, G. A. et al. From FastQ data to high confidence variant calls: the Genome Analysis Toolkit best practices pipeline. Curr. Protoc. Bioinforma. 43, 10.11–11.10.33 (2013).
D, M. A. et al. A framework for variation discovery and genotyping using next-generation DNA sequencing data. Nat. Genet. 43, 491–498 (2011).
McKenna, A. et al. The Genome Analysis Toolkit: a MapReduce framework for analyzing next-generation DNA sequencing data. Genome Res. 20, 1297–1303 (2010).
Weinreb, I. et al. Hotspot activating PRKD1 somatic mutations in polymorphous low-grade adenocarcinomas of the salivary glands. Nat. Genet 46, 1166–1169 (2014).
Schrijver, W. et al. Mutation profiling of key cancer genes in primary breast cancers and their distant metastases. Cancer Res. 78, 3112–3121 (2018).
Vadgama, N. et al. De novo single-nucleotide and copy number variation in discordant monozygotic twins reveals disease-related genes. Eur. J. Hum. Genet. 27, 1121–1133 (2019).
K, E. et al. Scalable open science approach for mutation calling of tumor exomes using multiple genomic Pipelines. Cell syst. 6, 271–281.e7 (2018).
Blokzijl, F., Janssen, R., van Boxtel, R. & Cuppen, E. MutationalPatterns: comprehensive genome-wide analysis of mutational processes. Genome Med. 10, 33 (2018).
Shen, R. & Seshan, V. E. FACETS: allele-specific copy number and clonal heterogeneity analysis tool for high-throughput DNA sequencing. Nucleic Acids Res. 44, e131 (2016).
Mermel, C. H. et al. GISTIC2.0 facilitates sensitive and confident localization of the targets of focal somatic copy-number alteration in human cancers. Genome Biol. 12, R41 (2011).
Acknowledgements
The authors thank all patients involved in this study, as well as their families/caregivers. We offer sincere gratitude to Prof. Allen C. Gao from UC Davis Medical Center for the constructive suggestions and careful revision for this manuscript. Thanks to Mrs. Dan Qin from basebiotech Co., Ltd and Ph.D Menghuan Zhang from GloriousMed Clinical Laboratory (Shanghai) Co., Ltd for providing help for bioinformatic analysis and raw data uploading. This work was supported by the Natural Science Foundation of China (NSFC 81972502, 81902577, 81974398,81872107 and 81872108), China Postdoctoral Science Foundation (2020M673239), Research Foundation for the Postdoctoral Program of Sichuan University (2021SCU12014), Post-Doctor Research Project, West China Hospital, Sichuan University (20HXBH026), 1.3.5 project for disciplines of excellence, West China Hospital, Sichuan University (No.0040205301E21), and Science and Technology Support Program of Sichuan Province (2021YFS0119).
Author information
Authors and Affiliations
Contributions
Study concept and design: S.G.X., J.R.C., J.Y.L., X.X.Y. 1, Z.H.L., P.F.S., N.C., H.Z.; Methodology, acquisition, analysis, or interpretation of the data: S.G.X., J.R.C., J.Y.L., X.X.Y. 1, M.N.Z., J.Y., N.H., L.M.Z., X.M.Z., S.Z., X.M.S., X.X.Y.2, W.B.Z., B.H.L., X.Y.P., L.N., L.Y., Y.T.C., J.G.Z., H.R.Z., J.D.D., Y.L.S., J.Y.L., R.H., J.D.L., Z.P.W., Y.C.N., D.Q., X.L., Q.Z., Z.H.L., P.F.S., N.C., H.Z.; Financial support: S.G.X., R.H., Q.Z., P.F.S., N.C., H.Z.; Drafting of the manuscript: S.G.X., J.R.C., J.Y.L., X.X.Y. 1; Critical revision of the manuscript for important intellectual content: S.G.X., J.R.C., J.Y.L., X.X.Y. 1, H.J.H, C.M.A., Z.H.L., P.F.S., N.C., H.Z.; Statistical analysis: S.G.X., J.R.C., J.Y.L., X.X.Y. 1, N.H.; Study supervision: Q.W, X.L., Q.Z., H.J.H, Z.H.L., P.F.S., N.C., H.Z. All authors read and approved the final manuscript. X.X.Y. 1 is representative of Xiaoxue Yin. X.X.Y. 2 is representative of Xiaoxia Yang.
Corresponding authors
Ethics declarations
Competing interests
The authors declare no competing interests.
Additional information
Peer review information Nature Communications thanks James Brugarolas and Ed Reznik for their contribution to the peer review of this work. Peer reviewer reports are available.
Publisher’s note Springer Nature remains neutral with regard to jurisdictional claims in published maps and institutional affiliations.
Rights and permissions
Open Access This article is licensed under a Creative Commons Attribution 4.0 International License, which permits use, sharing, adaptation, distribution and reproduction in any medium or format, as long as you give appropriate credit to the original author(s) and the source, provide a link to the Creative Commons license, and indicate if changes were made. The images or other third party material in this article are included in the article’s Creative Commons license, unless indicated otherwise in a credit line to the material. If material is not included in the article’s Creative Commons license and your intended use is not permitted by statutory regulation or exceeds the permitted use, you will need to obtain permission directly from the copyright holder. To view a copy of this license, visit http://creativecommons.org/licenses/by/4.0/.
About this article

Cite this article
Sun, G., Chen, J., Liang, J. et al. Integrated exome and RNA sequencing of TFE3-translocation renal cell carcinoma. Nat Commun 12, 5262 (2021). https://doi.org/10.1038/s41467-021-25618-z
Received:
Accepted:
Published:
DOI: https://doi.org/10.1038/s41467-021-25618-z
This article is cited by
-
Metabolic alterations in hereditary and sporadic renal cell carcinoma
Nature Reviews Nephrology (2024)
-
An endothelial-related prognostic index for bladder cancer patients
Discover Oncology (2024)
-
TFE3 nuclear expression as a novel biomarker of ovarian sclerosing stromal tumors and associated with its histological morphology
Journal of Ovarian Research (2023)
-
LncRNA like NMRK2 mRNA functions as a key molecular scaffold to enhance mitochondrial respiration of NONO-TFE3 rearranged renal cell carcinoma in an NAD+ kinase-independent manner
Journal of Experimental & Clinical Cancer Research (2023)
-
Emerging roles of TFE3 in metabolic regulation
Cell Death Discovery (2023)
Comments
By submitting a comment you agree to abide by our Terms and Community Guidelines. If you find something abusive or that does not comply with our terms or guidelines please flag it as inappropriate.
