Abstract
Novel MoWO4 with ZnO nanoflowers was synthesized on multi-walled carbon nanotubes (MW-Z@MWCNTs) through a simple hydrothermal method, and this unique structure was applied as a counter electrode (CE) for dye-sensitized solar cells (DSSC) for the first time. The synergetic effect of ZnO nanoflowers and MoWO4 on MWCNTs was systematically investigated by different techniques. The amount of MWCNTs was optimized to achieve the best DSSC performance. It was found that the 1.5% MW-Z@MWCNTs composite structure had the highest power conversion efficiency of 9.96%, which is greater than that of traditional Pt CE. Therefore, MW-Z@MWCNTs-based CE can be used to replace traditional Pt-based electrodes in the future.
Introduction
Electricity shortage is a long-standing problem all over the world due to the growing population every year. It is reported that most of the electric power comes from natural gas fuel (70%) followed by lignite and coal, causing serious environmental pollution problems, such as global warming and acid rain. Moreover, these energy sources will run out in the next 18 years; thus, there is a huge need for renewable energies1.
Solar cells are popular alternative energy sources because they are clean and can be used indefinitely. Among different solar cell generations, dye-sensitized solar cells (DSSC) have received considerable attention due to their inexpensive, non-toxicity, and easy manufacturing process2. Generally, DSSC is made of a mesoporous titanium dioxide (TiO2) thin film with dye molecules (N719), an electrolyte of iodide/triiodide (I−/I3−) couple, and a counter electrode (CE). In DSSC, excited dye molecules inject an electron into the conduction band (CB) of nanocrystalline TiO2 under exposure to light, and these oxidized dye molecules are subsequently reduced back to their original neutral state by electron donation from I− ions. The CE transfers electrons flowing from the external circuit to the redox reaction electrolyte and catalyzes the reduction of I3− ions3,4,5. However, in DSSC, platinum (Pt) is often used as CE, which is an expensive material and unsuitable for industrial production. In order to overcome this problem, different allotropes of carbon6, transition metal oxides7, transition metal selenide8, conductive polymers, and nanocomposites9 are used. A suitable CE should have higher catalytic effectiveness, a narrow bandgap, numerous catalytic active sites, good conductivity, fast electron-transfer channels, and charge transport properties. Unfortunately, research on the improvement of CE materials to increase the power conversion efficiency of DSSC is very limited.
Transition metal oxides nanomaterials such as TeO2, Bi2O3, MoO, WO4, BaO, etc., are used for the development of photovoltaic advanced materials, photocatalyst and smart device9. Among the metal oxides, tungsten oxide, WO4, is n-type semiconductor with a small bandgap of 2.6 eV which has unique thermal, optical, physic-chemical, absorbing ability and electrical proper. WO4 can be used as electron and hole transport layer due to its high carrier mobility, which will help to improve the carrier transport performance in the DSSC device. However, the photovoltaic applications of WO4 are limited because of its unfavorable conduction band edge position for one-electron reduction of O2 and hydrogen reduction reactions. This limitation leads to the fast electron–hole recombination rate and the lower photovoltaic and photocatalytic activity. Therefore, in order to prevent this constraint, the research team was interested in the combination of metal oxides and other materials. Gomathi et al. prepared non-toxic Ni-doped MoO3 nanostructures for CE through a facile hydrothermal route and obtained a power conversion efficiency (PCE) of 8.39% due to the high electrocatalytic activity of MoO3. Two-dimensional ZnO nanoflowers also have good visible transmittance, high chemical stability, excellent morphological properties, and high electron mobility (115–155 cm2)10. Rotaba Ansir et al. synthesized Pd@C with ZnO nanorods as a photoanode through a microwave treatment and the co-precipitation method and obtained an efficiency of ~ 3.60% due to the reduction in electron–hole recombination and the increase in the number of photo-generated e−/h+ 11.
In recent years, multi-walled carbon nanotubes (MWCNTs), due to their high surface area, excellent chemical stability, and high electrical conductivity, have been used to improve the properties of metal oxides. In 2021, Mahin Mirzaei and Mohammad Bagher Gholiv synthesized functionalized MWCNTs-encapsulated Ni-doped molybdenum diselenide (f-MWCNTs@NiMoSe2) by a hydrothermal route12 and found that the DSSC fabricated with f-MWCNTs@NiMoSe2 had an excellent catalytic activity with a high efficiency of 7.39%. The high PCE of MWCNTs@NiMoSe2 could be attributed to the presence of a large number of active sites and the good electrical conductivity of MoSe2. Therefore, in this work, novel MoWO4 with ZnO nanoflowers were synthesized on MWCNTs (MW-Z@MWCNTs) by a facile hydrothermal route for CE application in DSSC. The optimum content of MWCNTs was determined to achieve high PCE from DSSC.
Methods
Materials and reagents
MWCNTs with ≥ 95% purity (external diameter = 10–20 nm and length = 5–10 µm) were purchased from Sigma-Aldrich. Molybdenum oxide (MoO3; 99.97% trace metal basis), tungsten (VI) oxide powder (99.9%), ammonium sulfate ((NH4)2SO4; ACS reagent; ≥ 99.0%), zinc nitrate hydrate (Zn(NO3)2.6H2O; 99.99% trace metal basis), hexamethylenetetramine (HMTA), and hydrochloric acid (HCl) were obtained from Merck. Fluorine-doped SnO2 (FTO; 15 Ω) transparent glass and Surlyn thermoplastic polymer were procured from Solaronix. All these compounds were of analytical grade.
Synthesis of MW-Z@MWCNTs
MoWO4 was prepared through a simple hydrothermal route13. First, 3.29 g of MoO3 and 0.5 g of WO3 were dissolved in 70 mL of DI water under vigorous stirring for one hour. Subsequently, HCL (3 M) was slowly dropped in the solution until the value reached about 2. Further, 3.30 g of (NH4)2SO4 was added to the resultant solution, stirred continuously for 30 min before placing into a Teflon-lined autoclave enclosed in a stainless-steel tank, and held at 190 °C for 5 h. Finally, the solution was cooled at room temperature, washed several times with water and ethanol, and dried in the air at 90 °C for 12 h.
In order to ZnO nanoflower powder, 0.7 g of Zn(NO3)2·6H2O was dissolved in 75 mL of DI water, and 0.3 g of HMTA was dropped into the resultant solution. Subsequently, 0.9 g of NaOH was dissolved in 40 mL of DI water and added dropwise into the as-prepared solution. The solution was then continuously stirred at 500 rpm for 1 h at room temperature, kept in a Teflon-lined autoclave at 150 °C for 8 h, and finally, washed twice with water and dried at 80 °C overnight14.
In order to synthesize MW-Z@MWCNTs, 0.5 g of MWCNTs was added to 75 mL of dimethylformamide (DMF) under sonication for 2 h. Subsequently, 0.25 g of MoWO4 and 0.3 g of ZnO nanoflower powder were added into the mixture solution and continuously sonicated for 30 min. The resultant solution was kept in a Teflon-lined autoclave at 150 °C for 8 h, then washed several times with water and ethanol, and finally, placed in a hot-air oven at 80 °C for 24 h. The schematic diagram for MW-Z@MWCNTs fabrication is displayed in Fig. 1.
Fabrication of DSSC cell
The Doctor blade method was used to prepare the TiO2 paste photoanode and the MW-Z@MWCNTs CE with I−/I3− pairs of the liquid electrolyte on the FTO substrate. The TiO2 paste was soaked in a ruthenium (N719) solution overnight, and the MW-Z@MWCNTs CE was deposited on the FTO substrate by the spin coating technique. A Surlyn film (approximately 30 µm) was used to clip the TiO2 paste photoanode and the MW-Z@MWCNTs CE together in a sandwich-type cell.
Characterization
The phase compositions of the resultant composites were detected by X-ray diffraction analysis (XRD) under Cu-Kα1 radiation at 1.2 kVA (Rigaku, SmartLab). The morphology and surface characteristics of the composite samples were determined by a Fourier-transform scanning electron microscope (FE-SEM; ThermoFisher Scientific, Apreo2, Germany), and their surface elemental composition and oxidation state were analyzed by X-ray photoelectron spectroscopy (XPS; PHI5000 VersaProbe II ULVAC-PHI, Japan) at Synchrotron Light Research Institute (SLRI), Thailand. A monochromatized Al-Kα X-ray source (hγ = 1486.6 eV) was used to excite the samples. Electrochemical impedance spectroscopy (EIS) was conducted in a frequency range from 0.01 to 100 kHz at a bias voltage of 0 V and an amplitude of 10 mV. Current density–voltage (J–V) characteristics were measured by a Keithley 2400 solar simulator under 100 mW/cm2 illumination.
Results
XRD analysis
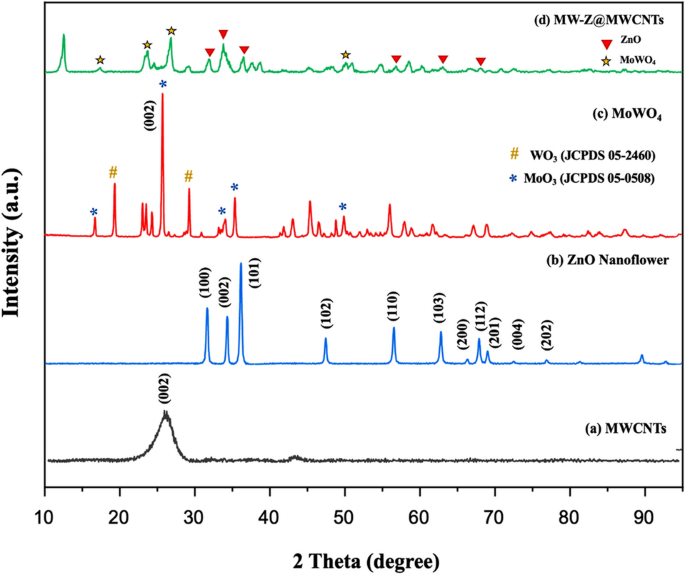
The phase structures of the composite samples were determined by XRD (Fig. 2). In the XRD pattern of MWCNTs, a sharp peak appeared at 26.0° corresponding to (002) reflection. The diffraction peaks of ZnO nanoflowers at 2θ = 31.84°, 34.53°, 36.35°, and 49.8° were related to (100), (002), (101), and (102) reflections, confirming that they possessed a hexagonal wurtzite structure (JCPDS 79-0207)15. In the XRD spectra of MoWO4, the peak appeared from the (002) plane of WO3 was stronger than other peaks, and it happened due to the preferred orientation of WO3 under the effect of Mo atoms (Fig. 2c). It is confirmed from Fig. 2d that the as-prepared MW-Z@MWCNTs were composed of an interconnected structure.
Morphological analysis
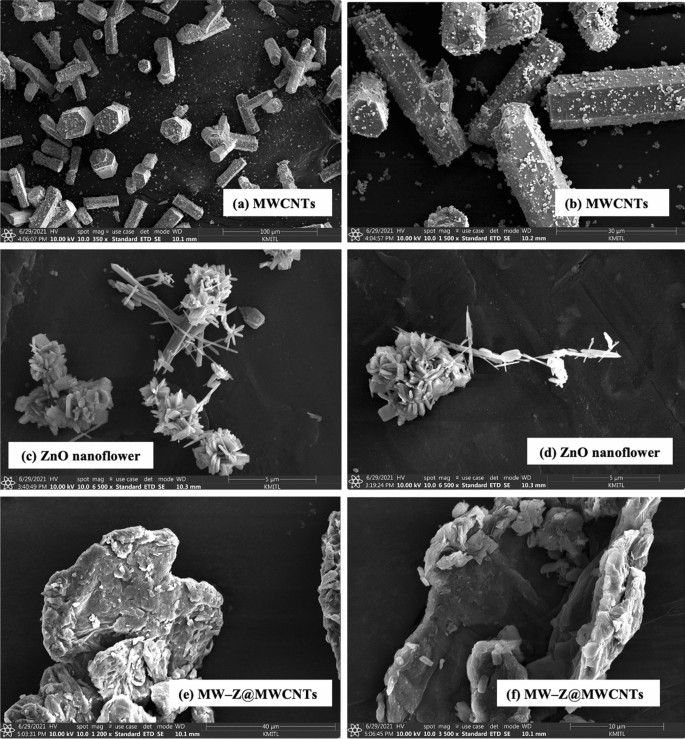
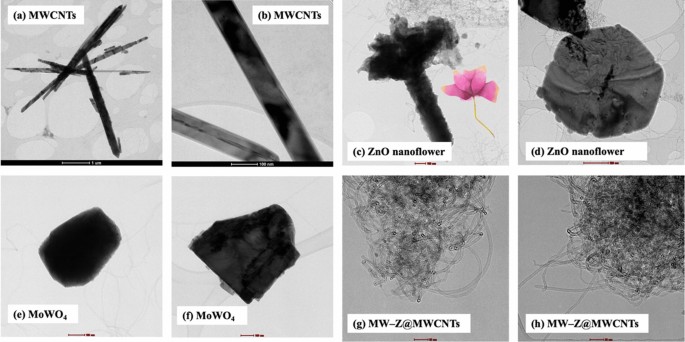
The morphology of MW-Z@MWCNTs was identified by FE-SEM and TEM. The morphology and particle size of MWCNTs are displayed in Fig. 3a,b. It is noticeable that MWCNTs consisted of octahedral-shaped overlapping small tubes of 20–30 µm size. It is clear from Fig. 3(c,d) that ZnO nanoflowers contained densely packed nanoneedles. These flower-like clusters were distributed across the surface substrate16. The morphology of MW-Z@MWCNTs is presented in Fig. 3(e,f). MW-Z@MWCNTs were found to be clumped together and possessed an indefinite morphology. The internal microstructural arrangement of the as-synthesized samples was determined by TEM (Fig. 4). It is noticeable from Fig. 4a,b that long MWCNTs with 5–50 nm external diameter overlapped each other. Furthermore, the formation of ZnO nanoflowers can be observed in Fig. 4(c,d). In a single nanoflower structure, petal spikes of 600–800 nm size were superficially directed and extended from the center of the flower. In comparison, MoWO4 had a relatively flatter morphology with a particle size of about 100 nm. Moreover, the black spots on MW-Z@MWCNTs indicate the attachment of ZnO nanoflowers and MoWO4 MWCNTs walls17.
FTIR analysis
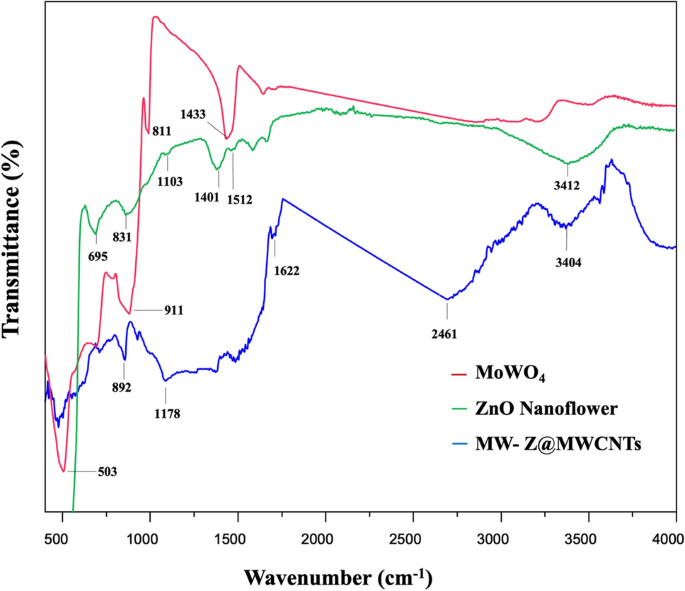
FTIR spectra in the wavenumber range of 400–4000 cm−1 were used to determine the chemical bonding state of ZnO nanoflowers, MoWO4, and MW-Z@MWCNTs (Fig. 5). In the spectrum of MoWO4, the bands at 811 cm−1 and 503 cm−1 appeared from the symmetrical vibration of Mo–W–O groups and the stretching vibration of Mo–O bonds, respectively. Moreover, the strong band at 620 cm−1 was formed due to the asymmetrical stretching vibration of W–O bonds in (W2O4)n chains18. In the spectrum of ZnO nanoflower, the characteristic band at 3412 cm−1 appeared from the stretching vibration of hydroxyl (OH) groups. The small peak around 1103 cm−1 could be assigned to the symmetric stretching of C–O–C bonds stretching mode. The deformation of OH groups occurred at 1401 cm−1. The peak around 1512 cm−1 could be attributed to the strong mode of vibration of C=O19. Moreover, the peaks around 695 cm−1 and 879 cm−1 appeared from the hexagonal phase of ZnO and the stretching vibration of C–O, respectively. In the spectrum of MW-Z@MWCNTs, the absorption bands at 3404 cm−1 and 1622 cm−1 appeared due to O–H bonding on the surface of MWCNTs. The peak at 892 cm−1 indicates the presence of O-C bonds in purified MWCNTs20.
Raman spectroscopy
Raman spectroscopy was used to characterize intrinsic defects in ZnO nanoflowers, MoWO4, and MW-Z@MWCNTs (Fig. 6). The E2H–E2L and A1T modes at ∼331 and ∼380 cm−1, respectively, appeared from ZnO nanoflower crystals (line (a)). The peaks at ∼436 and ∼583 cm−1 could be assigned to the E2H and E1L phonon modes, respectively. The E2H mode represents a typical wurtzite crystal structure and reflects a perfect ZnO nanoflower crystal property. In addition, the centered peak of ZnO nanoflower at 569 cm‒1 and 1143 cm‒1 which corresponded to the first, second and third-order LO phonon bands of ZnO. To further obtain more information about structural and presence or absence of vibrational modes Raman spectra for MoWO4 shown in Fig. 6b, The Raman bands at 109 cm−1 and 225 cm−1 appeared from the A1g and E2g phonon modes and were related to the layered 2H phase of MoWO4. The Raman bands at 612, 702, 805 and 900 cm‒1 have been linked to the υ(O–W–O) stretching vibrational modes. In the Raman spectrum of MW-Z@MWCNTs, the peak at 1306 cm−1 corresponds to the defect (D) band (disorder-induced structures, tube ends, staging disorder), the peak at 1502 cm−1 corresponds to crystalline graphitic structures (G band), and the peak at 2728 cm−1 corresponds to the replica of the D band21,22.
XPS analysis
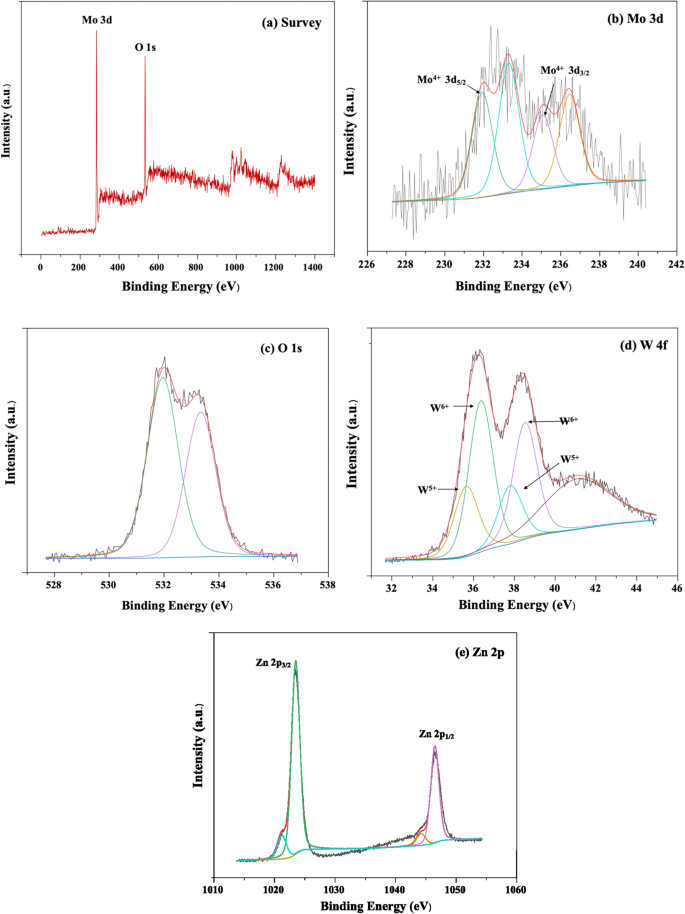
The XPS spectra of MW-Z@MWCNTs are displayed in Fig. 7. The presence of Mo, W, Zn, and O was well detected in MW-Z@MWCNTs (Fig. 7a). Figure 7b presents the high-resolution XPS spectrum of the Mo 3d peak. The binding energies of Mo 3d3/2 and Mo 3d5/2 were calculated as 235.0 eV and 231.5 eV, respectively, indicating the existence of Mo atoms in the + 4 oxidation state23. Moreover, the peaks at 531.4 eV and 533.1 eV could be assigned to oxygen atoms in MoWO4 (Fig. 7c). The spin–or-bit doublets at 35.6 eV, 37.6 eV, and 41.5 eV in the W 4f spectrum correspond to the W 4f7/2, W 4f5/2, and W 5p3/2 peaks, respectively, indicating the existence of W atoms in the + 6 oxidization state24. In Fig. 7e, the binding energies of 1021.70 eV and 1045.78 eV could be assigned to the Zn 2p3/2 and Zn 2p1/2 peaks, respectively.
N2 adsorption–desorption isotherm (BET) analysis
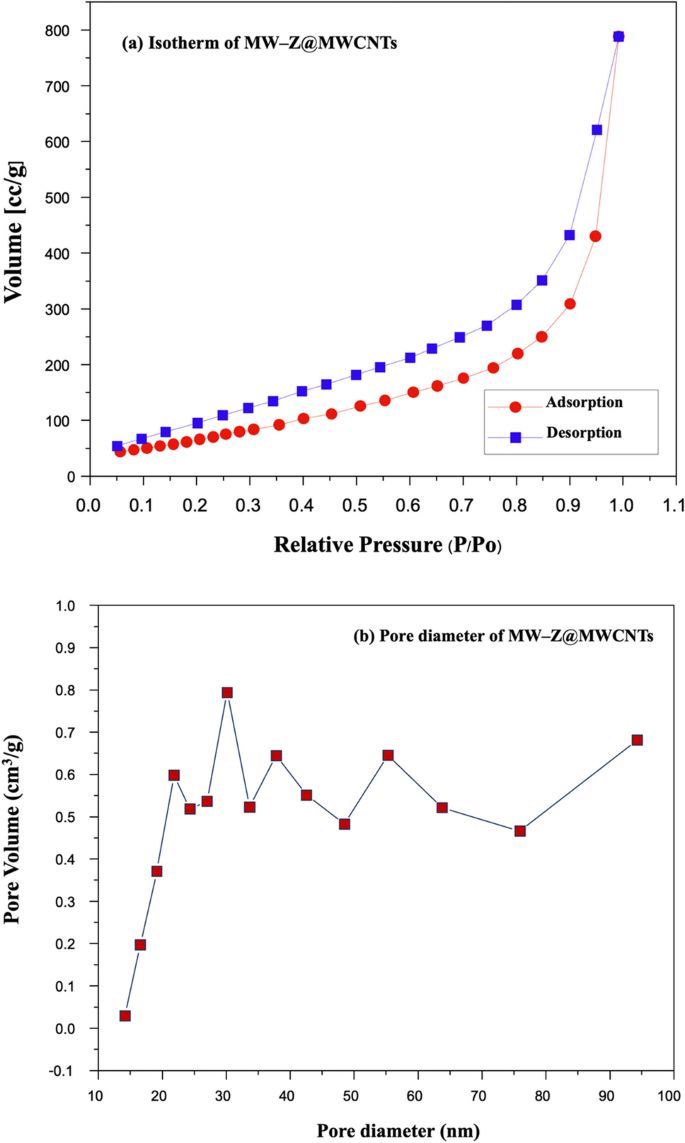
N2 adsorption–desorption measurements were performed to measure the specific surface areas of MW-Z@MWCNTs (Fig. 8). In a typical BET analysis, a measure of the specific surface area (SSA) of MW-Z@MWCNTs is determined from the volume of N2 gas adsorbed on the MW-Z@MWCNTs. The basics Brunauer, Emmett, and Teller (BET) theory, the most common method used to describe the specific surface area followed the equation:
where W is the weight of gas adsorbed, P/P0 is the relative pressure, Wm is the weight of adsorbate as a monolayer, and C is the BET constant. Type II isothermals with H3 hysteresis could be attributed to the mesoporous structure of the samples25. Moreover, the large specific surface area (30.33 m2g–1) and pore size (about 30 nm) of MW-Z@MWCNTs significantly facilitated the access of the electrolyte and allowed rapid charge transfer kinetics to improve the power conversion efficiency of DSSC.
Photovoltaic study of DSSCs with different counter electrodes
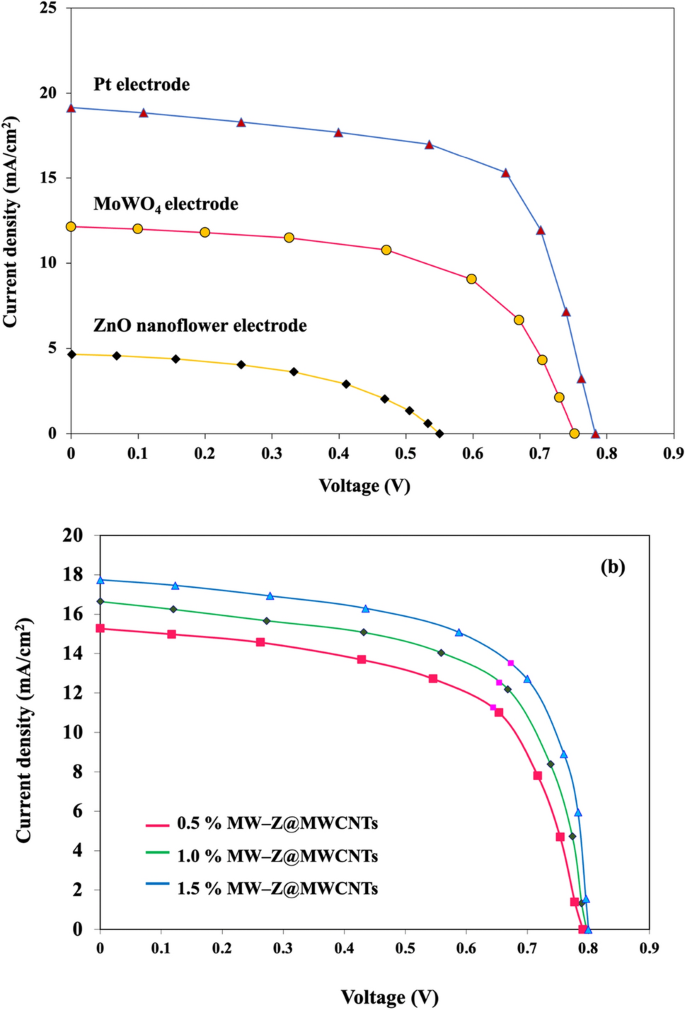
The PCE values of different CEs for DSSC were calculated by a Class AAA solar simulator under AM 1.5G simulated sunlight (Fig. 9 and Table 1). The 1.5% MW-Z@MWCNTs CE yielded the highest power conversion efficiency of 9.96% with Voc = 0.78 V, Jsc = 19.16 mA/cm2, and FF = 0.66 followed by 1.0% MW-Z@MWCNTs (PCE = 8.19%) and 0.5% MW-Z@MWCNTs (PCE = 7.25%), which are greatly higher than those of traditional Pt CE, pure ZnO nanoflower CE, and MoWO4 CE under the same conditions. The higher PCE of MW-Z@MWCNTs could be attributed to the presence of ZnO nanoflowers and MoWO4 on MWCNTs, resulting in a large surface area and good charge electron transport capacity, which synergistically improved the electrocatalytic activity of the CE. In addition, the higher Voc of 1.5% MW-Z@MWCNTs could be ascribed to the efficient regeneration of the N719 dye with this CE, resulting in the generation of a greater number of excitons. The high surface area for adsorption capacity, the MWCNTs, and ZnO nanoflower result in an improvement in electron–hole pair production. Moreover, the enhanced performance is due to an improved conductive path between the MoWO4 nanoparticles by the addition of MWCNTs which displays remarkable catalytic activity in the reduction of I−326.
Electrochemical impedance spectroscopy (EIS) analysis
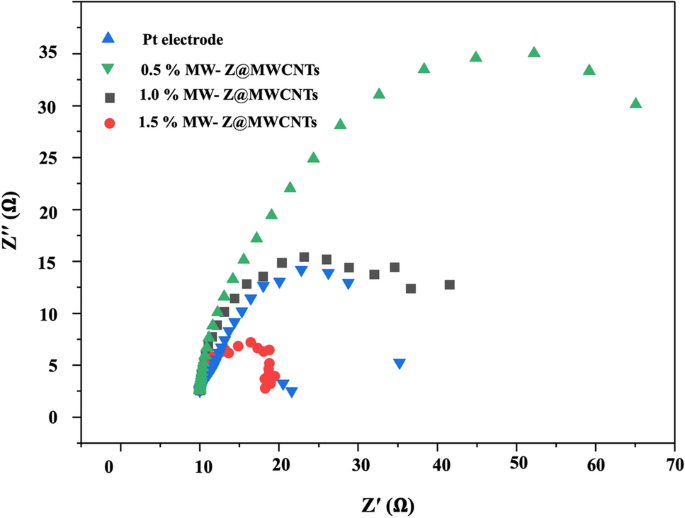
The Nyquist plots of different CEs were measured to determine the ionic and electronic transport process of the DSSCs as shown in Fig. 10 and Table 1. Normally, two apparent semi-circles are detected in the Nyquist plots. The small arc at a high frequency is attributed to the resistance between the counter electrode and electrolyte mediator. The large arc at the mean frequency is associated with charge transfer resistance (Rct) at the interfaces of MW-Z@MWCNTs with electrolyte and dye molecules. The resistance element RS in the high-frequency region (> 105 Hz) is ascribed to the sheet resistance of the FTO substrates. Similar resistance for counter electrode (RCE), deduced from high-frequency semi-circle, implies that we used the Pt as a reference counter electrode by replacement of MW-Z@MWCNTs through our experiments. The Rct value of the 1.5% MW-Z@MWCNTs CE was lower than those of other electrodes. The Rct value increased greatly with the decrease of MWCNTs percentage because the addition of MWCNTs significantly improved the charge transfer capability of MW-Z@MWCNTs CE. Furthermore, the 1.5% MW-Z@MWCNTs CE enhanced the electrocatalytic effect of accessible and interconnected pores in ZnO nanoflowers and MWCNTs, allowing more efficient electron transfer between the electrode and the electrolyte to enhance the reduction reaction of the redox couple.
Conclusion
Novel MW-Z@MWCNTs were successfully synthesized by a simple hydrothermal route for CE applications in DSSC. The chemical states, morphologies, and catalytic properties of ZnO nanoflowers, MoWO4, and MW-Z@MWCNTs were analyzed. The 1.5% MW-Z@MWCNTs structure exhibited better I−3 electrocatalytic activity than Pt CE under the same conditions. The addition of MWCNTs greatly enhanced the electron charge transport capacity and surface area of ZnO nanoflowers. Hence, this unique MW-Z@MWCNTs structure can serve as an efficient CE for Pt-free DSSCs.
Data availability
The data that support the findings of this study are presented in the main text and are available from the corresponding author upon request.
References
Partridge, T., Thomas, M., Pidgeon, N. & Harthorn, B. H. Urgency in energy justice: Contestation and time in prospective shale extraction in the United States and United Kingdom. Energy Res. Soc. Sci. 42, 138–146 (2018).
Zatirostami, A. Electro-deposited SnSe on ITO: A low-cost and high-performance counter electrode for DSSCs. J. Alloys Compd. 844, 156151 (2020).
Mohammadi, I., Zeraatpisheh, F., Ashiri, E. & Abdi, K. Solvothermal synthesis of g-C3N4 and ZnO nanoparticles on TiO2 nanotube as photoanode in DSSC. Int. J. Hydrog. Energy 45(38), 18831–18839 (2020).
Gao, X. et al. In situ synthesis of cobalt triphosphate on carbon paper for efficient electrocatalyst in dye-sensitized solar cell. Sol. Energy 208, 289–295 (2020).
Vijaya, S., Landi, G., Wu, J. J. & Anandan, S. Ni3S4/CoS2 mixed-phase nanocomposite as counter electrode for Pt free dye-sensitized solar cells. J. Power Sources 478, 229068 (2020).
Narudin, N., Ekanayake, P., Soon, Y. W., Nakajima, H. & Lim, C. M. Enhanced properties of low-cost carbon black-graphite counter electrode in DSSC by incorporating binders. Sol. Energy 225, 237–244 (2021).
Zingwe, N., Meyer, E. & Mbese, J. Evaluating the efficacy of binary palladium alloy PdO-Pd for use as an electrocatalyst in DSSC counter electrodes, South African. J Chem. Eng. 37, 92–97 (2021).
Pesko, E., Zukowska, G., Zero, E. & Krzton-Maziopa, A. Electrocrystallization of nanostructured iron-selenide films for potential application in dye sensitized solar cells. Thin Solid Films 709, 138121 (2020).
Thomas, M. & Jose, S. Electrospun membrane of PVA and functionalized agarose with polymeric ionic liquid and conductive carbon for efficient dye sensitized solar cell. J. Photochem. Photobiol. 425, 113666 (2022).
Naidu, R. S. & Swaminathan, G. Fabrication and characterization of dye sensitized solar cell with ZnO nanoflowers as photoelectrode. Mater. Today Proc. 42(2), 637–641 (2021).
Ansir, R., Ullah, N., Ünlü, B., Shah, S. M. & Özacar, M. Effect of annealing temperatures on performance of DSSCs fabricated using Ag or Pd@C@ZnO composites as photoanode materials. Sol. Energy 224, 617–628 (2021).
Mirzaei, M. & Gholivand, M. B. Introduction of Pt-free counter electrode based on f-MWCNTs@NiMoSe2 nanocomposite for efficient dye-sensitized solar cells. Sol. Energy 227, 67–77 (2021).
Liu, H., Zhang, J., Wen, Z. & Han, J. Synthesis, sinterability, conductivity and reducibility of K+ and W6+ double doped La2Mo2O9. Solid State Ion. 276, 90–97 (2015).
Badgujar, H. F., Bora, S. & Kumar, U. Eco-benevolent synthesis of ZnO nanoflowers using Oxalis corniculata leaf extract for potential antimicrobial application in agriculture and cosmeceutical. Biocatal. Agric. Biotechnol. 38, 102216 (2021).
Cai, Y. & Yao, C. B. Study of well-aligned Ag@ZnO nanoflower arrays with growth, photoluminescence and ultrafast nonlinear absorption properties. Opt. Mater. 120, 111383 (2021).
Luo, L., Zhong, J. & Li, J. Photocatalytic property of MWCNTs/BiOI with rich oxygen vacancies. Mater. Res. Bull. 150, 111763 (2022).
Hazarika, M., Chinnamuthu, P. & Borah, J. P. Enhanced photocatalytic efficiency of MWCNT/NiFe2O4 nanocomposites. Phys. E Low Dimens. Syst. Nanostruct. 139, 115177 (2022).
Askari, N., Beheshti, M., Mowla, D. & Farhadian, M. Facile construction of novel Z-scheme MnWO4/Bi2S3 heterojunction with enhanced photocatalytic degradation of antibiotics. Mater. Sci. Semicond. Process. 127, 105723 (2021).
Vennerberg, D., Hall, R. & Kessler, M. R. Supercritical carbon dioxide-assisted silanization of multi-walled carbon nanotubes and their effect on the thermo-mechanical properties of epoxy nanocomposites. Polymer 55, 4156–4163 (2014).
Naganathan, D., Thangamani, P., Selvam, T. & Narayanasamy, T. Ce doped ZnO/f-MWCNT moss ball like nanocomposite: A strategy for high responsive current detection of l-tryptophan. Microchim. Acta 185, 96 (2018).
Begum, S. et al. Investigation of morphology, crystallinity, thermal stability, piezoelectricity and conductivity of PVDF nanocomposites reinforced with epoxy functionalized MWCNTs. Compos. Sci. Technol. 211, 108841 (2021).
Yasin, M. et al. Development of Bi2O3–ZnO heterostructure for enhanced photodegradation of rhodamine B and reactive yellow dyes. Surf. Interfaces 2022, 101846 (2022).
Wang, Z. et al. Porous molybdenum tungsten oxynitrides enable long-life supercapacitors with high capacitance. J. Power Sources 442, 227247 (2019).
Sundaresan, R., Mariyappan, V., Chen, S. M., Keerthi, M. & Ramachandran, R. Electrochemical sensor for detection of tryptophan in the milk sample based on MnWO4 nanoplates encapsulated RGO nanocomposite. Colloids Surf. A Physicochem. Eng. Asp. 625, 126889 (2021).
Gao, X., Li, L., An, M., Zheng, T. & Ma, F. ZnO QDs and three-dimensional ordered macroporous structure synergistically enhance the photocatalytic degradation and hydrogen evolution performance of WO3/TiO2 composites. J. Phys. Chem. Solids 165, 110655 (2022).
Bu, I. Y. Hydrothermal production of low-cost bismuth sulfide/reduced graphene oxide nanocomposite as counter electrode for DSSCs. Optik 217, 164868 (2020).
Acknowledgements
The authors are also grateful for the support received from the FE-SEM center, School of Engineering, King Mongkut’s Institute of Technology Ladkrabang, Bangkok. The authors acknowledge the support from Asst. Prof. Pawinee Klangtakai, Department of Physics, Khon Kaen University.
Author information
Authors and Affiliations
Contributions
Y.A., C.H. and T.N. conceived and planned the experiments. Y.A. and C.H. carried out the experiment. Y.A. wrote the manuscript with support from K.P. and W.C.O. P.S., S.N. and N.L. verified the analytical methods. All authors discussed the results and contributed to the final manuscript.
Corresponding author
Ethics declarations
Competing interests
The authors declare no competing interests.
Additional information
Publisher's note
Springer Nature remains neutral with regard to jurisdictional claims in published maps and institutional affiliations.
Rights and permissions
Open Access This article is licensed under a Creative Commons Attribution 4.0 International License, which permits use, sharing, adaptation, distribution and reproduction in any medium or format, as long as you give appropriate credit to the original author(s) and the source, provide a link to the Creative Commons licence, and indicate if changes were made. The images or other third party material in this article are included in the article's Creative Commons licence, unless indicated otherwise in a credit line to the material. If material is not included in the article's Creative Commons licence and your intended use is not permitted by statutory regulation or exceeds the permitted use, you will need to obtain permission directly from the copyright holder. To view a copy of this licence, visit http://creativecommons.org/licenses/by/4.0/.
About this article
Cite this article
Areerob, Y., Hamontree, C., Sricharoen, P. et al. Synthesis of novel MoWO4 with ZnO nanoflowers on multi-walled carbon nanotubes for counter electrode application in dye-sensitized solar cells. Sci Rep 12, 12490 (2022). https://doi.org/10.1038/s41598-022-16791-2
Received:
Accepted:
Published:
DOI: https://doi.org/10.1038/s41598-022-16791-2
This article is cited by
-
Fabrication of highly efficient and cost-effective dye-sensitized solar cells using ZnO/MWCNT nanocomposite as photoanode
Journal of Solid State Electrochemistry (2023)
Comments
By submitting a comment you agree to abide by our Terms and Community Guidelines. If you find something abusive or that does not comply with our terms or guidelines please flag it as inappropriate.


