
Abstract
‘Tripartite network’ (TN) and ‘combined gene network’ (CGN) were constructed and their hub-bottleneck and driver nodes (44 genes) were evaluated as ‘target genes’ (TG) to identify 21 ‘candidate genes’ (CG) and their relationship with neurological manifestations of COVID-19. TN was developed using neurological symptoms of COVID-19 found in literature. Under query genes (TG of TN), co-expressed genes were identified using pair-wise mutual information to genes available in RNA-Seq autopsy data of frontal cortex of COVID-19 victims. CGN was constructed with genes selected from TN and co-expressed in COVID-19. TG and their connecting genes of respective networks underwent functional analyses through findings of their enrichment terms and pair-wise ‘semantic similarity scores’ (SSS). A new integrated ‘weighted harmonic mean score’ was formulated assimilating values of SSS and STRING-based ‘combined score’ of the selected TG-pairs, which provided CG-pairs with properties of CGs as co-expressed and ‘indispensable nodes’ in CGN. Finally, six pairs sharing seven ‘prevalent CGs’ (ADAM10, ADAM17, AKT1, CTNNB1, ESR1, PIK3CA, FGFR1) showed linkages with the phenotypes (a) directly under neurodegeneration, neurodevelopmental diseases, tumour/cancer and cellular signalling, and (b) indirectly through other CGs under behavioural/cognitive and motor dysfunctions. The pathophysiology of ‘prevalent CGs’ has been discussed to interpret neurological phenotypes of COVID-19.
Introduction
The ‘coronavirus disease 2019’ (COVID-19) patients present common symptomatic features of dry cough, dyspnoea, fever, fatigue and myalgia followed by acute respiratory distress syndrome (ARDS) and multiorgan failure in an advanced stage1. COVID-19 is caused by severe acute respiratory syndrome coronavirus 2 (SARS-CoV-2), having positive single-stranded RNA as its genome1,2. The pathophysiological action of the virus always begins with the binding of spike proteins onto the angiotensin-converting enzyme 2 (ACE2) receptor proteins in the host cell membranes and expresses several phenotypic manifestations in human2. Human ACE2 receptors are constitutively expressed in different types of tissue cells in diverse regions of the brain3. COVID-19 causes structural/morphological changes in different areas of the brain4 and develops neurological and psychiatric symptoms5. Moreover, the SARS-CoV-2 infection in the brain culminates in inflammation of the meninges and perivascular space6.
The SARS-CoV-2 can enter the brain through three possible pathways via (1) the inflammatory supporting cells of the olfactory mucosa6, (2) the endothelial cells of the cerebral blood vessels7,8 and (3) the nerve terminals of the vagi in the respiratory7,8 and gastrointestinal tracts. SARS-CoV-2 is found to be present in the cerebrospinal fluid (CSF) of patients, suggesting the predominance of immunological damages over the viral replication in neurons8. Among the three pathways, the first one appears to be the most important, as a majority of the COVID-19 case reports suggest anosmia and ageusia/dysgeusia as the non-specific symptoms9. The clinical reports and the neuroimaging studies suggest that the cytokine storm and oxidative stress along with the reduction of GSH levels are two key mechanisms that can produce neurodegenerations in certain areas of the human brain10,11. It is speculated that COVID-19-related symptoms can together act as direct or indirect mediators of various neurodegenerative diseases including dementia, Alzheimer’s disease, and Parkinson’s disease, although the exact mechanism is still in debate.
The literature studies12,13,14,15 including the latest retrospective cohort study13 on 2,36,379 COVID-19 survivors indicate that > 30% of patients have neurological or psychiatric problems. The reports indicate that cognitive alterations (delirium with a combination of acute disturbances in attention, awareness and cognition, anxiety, sleep disorders), motor dysfunctions (dizziness, syncope, cerebellar ataxia, dysautonomia, seizure and epileptogenesis, tremors), cerebrovascular changes (cerebral ischaemia and infarct, stroke, focal ischemic necrosis, oedema, cerebral and subarachnoid haemorrhage, subdural haematoma, cerebral venous sinus thrombosis), cerebro-structural changes (meningitis/encephalitis, encephalopathy, necrotizing hemorrhagic encephalopathy, multifocal lesions in both cerebral hemispheres, leptomeningeal enhancement, myelitis, spinal cord myelitis, cranial neuropathy) are found in COVID-19 patients12,13,14,15. The symptoms related to disorders in the peripheral nervous system13,14,15 including muscle diseases (myopathy, muscle injury) and peripheral neuropathy/polyradiculopathy (viz. Guillain–Barré syndrome), may occur in certain cases.
In the present scenario, there is one bioinformatics-driven systems-level study using bipartite models of disease-gene, disease-disease, miRNA-gene and drug-protein interactions, which reveals that a variety of neurological symptoms including dementia, ataxia, encephalopathy and stroke along with their associated genes lined with multiple cellular functional pathways, can be therapeutically targeted by repurposed drugs or chemical compounds16. Additionally, a tripartite network modelling has been reported encompassing endocrine-disrupting chemicals (EDC), targeting proteins and diseases as the three types of nodes that decipher putative links between EDCs, COVID-19 severity and association to other diseases17. A systems-level modelling study18 has been conducted for the construction of a tripartite network of symptom-disease-gene to unravel the interplay between phenotype and genotype during disease conditions that are not limited to nervous system manifestation. Recent network-based findings of hub-bottleneck nodes for drug repurposing study report the involvements of several molecules associated with immunological systems (viz. cytokines e.g., TNFα, IL-1β,-6,-10 and chemokines e.g., CXCL8 and CCL2), growth factor function (e.g., VEGFA), cell-to-cell interaction (e.g., ICAM1), and signal transduction pathway (e.g., AKT1) with the neurological complication in COVID-1919.
In the present study, a novel approach has been introduced, for the first time to the best of our knowledge, to develop a model of predictive ‘candidate genes’ and their associations with neurological phenotypes of COVID-19. Initially, a tripartite network (TN) has been constructed using literature evidenced neurological symptoms of COVID-19 as input, whereby integrated weightage of symptoms and diseases are implied to get the most robust predictive genes for TN. Secondly, the predictive ‘target genes’ evaluated from TN have been considered as co-regulated in tissue and used as query genes to identify a set of co-expressed genes (CG) from RNA-Seq data of the frontal cortex of COVID-19 patients using pairwise mutual information (transcriptional gene–gene interaction from expression levels) to genes. The ‘combined gene network’ (CGN) has been constructed using genes selected in TN and co-expressed genes evaluated from RNA-Seq data of COVID-19. Both networks are analysed topologically and functionally to get ‘candidate genes’ and their connections with functional annotations to determine the putative molecular pathophysiology in the brain associated with COVID-19.
Methods
The methodological approaches with inclusion and exclusion criteria applied in the present multiple computational analyses are documented in the flow diagram (Fig. 1). Briefly, this study was executed initially through literature search using keywords viz. ‘COVID-19, Brain’ as inclusion criteria. The literatures were selected based on exclusion criteria, and the ‘neurological symptoms/manifestations’ of COVID-19 patients were identified from these selected literatures. The exclusion of research articles (Table S1 in Supplementary File 1) and selection of ‘neurological symptoms/manifestations’ were curated manually (Table S2 in Supplementary File 1). Further, multiple steps with computational analyses had been introduced for the constructions of ‘Tripartite network’ (TN), integration of predicted genes found in TN with co-expressed genes in the brain of COVID-19 patients identified using the transcriptomic database to develop a ‘combined gene network’ (CGN) and finding of the ‘target genes’ followed by ‘candidate genes’ with their functional enrichments. Notably, the present study used several bioinformatics tools having respective methods and relevant citations (Supplementary File 2) mentioned in their respective web links.
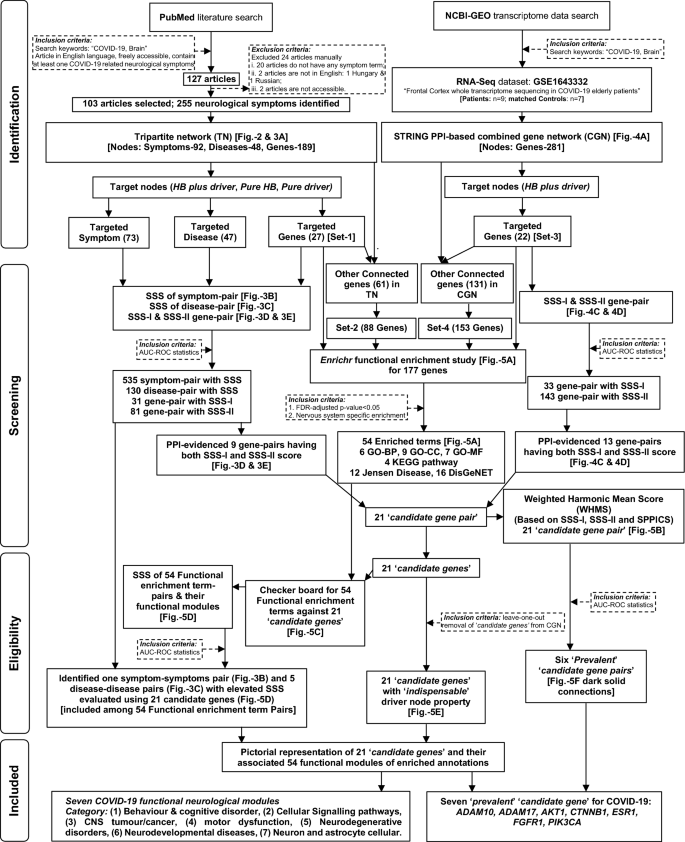
The flowchart of the stringent methodologies applied orderly and the results found in a systems-level analysis to identify ‘candidate genes’ and associated functional modules (symptoms/diseases) related to neurological manifestations of COVID-19.
In silico modelling of the Tripartite Network (TN) for COVID-19
The stepwise approach for construction of TN having nodes (symptom-disease-gene) and their connections (edges) developed by mathematical and statistical formulations is presented in the pictorial diagram (Fig. 2). Briefly, two bipartite networks (BN) of symptom-disease (step-2) and symptom-gene (step-3) were constructed where (a) terms/keywords of neurological symptoms related to COVID-19 collected by bibliographic literature search through PubMed portal (https://pubmed.ncbi.nlm.nih.gov/) were used as inputs (step-1) to retrieve (b) diseases and genes from the Human Phenotype Ontology (HPO, https://hpo.jax.org/) database. The symptoms were assigned by weightage (‘bibliographic keyword citation frequency’20; fbkc(Si); Table S2 in Supplementary File 1) followed by finding their connectivity (Nsd(Si) or Nsg(Si); Table S3 in Supplementary File 1) probability scores to diseases (fbkc(Si)/Nsd(Si)) and genes (fbkc(Si)/Nsg(Si)) considering co-occurrence of at least one disease/gene connection to one symptom term following the principle of frequency of the co-occurrence of root node in the directed acyclic graph21. The connections between symptom-disease and symptom-gene were selected statistically (false discovery rate (FDR)-adjusted p < 0.001) in both BNs. Further, two BNs were linked through the implementation of “Elite” disease-gene interactions (Ndg(di); Table S4 in Supplementary File 1) using ‘Sorl’s relevance scores’ (Smalacards) retrieved from Malacards (https://www.malacards.org/) database (step-4). Additionally, the disease-gene interactions were refined by two steps viz. (a) assigning integrated symptom-based weightage (Wd(Di)) of diseases by calculating average ‘connection probability scores’ (fbkc(si)/Nsd(si)) of symptoms to diseases (step-5) followed by (b) calculating integrated weightage (Wg(gi)) of genes as disease-gene ‘integrated connection scores’ by multiplying Wd(Di) with Malacards-scores (step-6) considering co-occurrence of connections of one disease to one symptom and one gene term in the network. The stringent connections in symptom-disease (step-2), symptom-gene (step-3) and disease-gene (step-6) were selected statistically (FDR-adjusted p < 0.001). The intra-edges of nodes were constructed using (a) ‘cosine semantic similarity scores’ ≥ 0.70 for symptom-symptom and disease-disease pairs, considering each symptom node as a vector of connected diseases and vice versa22 (Table S5 in Supplementary File 1) and (b) ‘STRING-PPI confidence score’ (SPPICS) ≥ 0.70 (https://string-db.org/) for gene–gene pairs. TN was developed in Cytoscape software (http://www.cytoscape.org/).

Study design for the construction of the tripartite network (TN) for COVID-19: Stepwise presentation of the construction of TN having symptoms, diseases and genes as nodes and their interactions as edges including inter-edges (viz., symptom-disease, symptom-gene, disease-gene) in point-1 to point-6 and intra-edges (viz. symptom-symptom, disease-disease, gene–gene) in Point-7 to point-9 of description. Point-1: Extraction of symptoms as terms associated with neurological disorders in COVID-19 from the PubMed bibliographic literature database and assigning a metric viz. bibliographic occurrence frequency (fbkc) to each term of symptom. Point-2 and Point-3: Extraction of the interactions between symptom-to-disease (point-2) and symptom-to-gene (point-3) from the HPO database using the symptom terms as queries and calculating their respective connectivity probability score followed by the selection of best-fitted connections using the statistical analysis of FDR-adjusted p < 0.001. Point-4: Extraction of the ‘Elite’ disease-gene connections with respective Solr-based relevance score (Smalacards) from Malacards database using symptom-associated disease terms (found in point-2) as queries with respect to symptom-associated gene terms (found in point-3). Point-5 and Point-6: Implication of symptoms in connections of disease-genes by computing ‘weightage of average contribution’ of symptoms in diseases (Wd(Di)) and that of diseases in genes (Wg(gi)) to find the Elite’ Disease-gene connection considering co-occurrence of at least connections of one disease to one symptom and one gene terms in the network. The FDR-adjusted p < 0.01 was used to filter weighted-based disease-gene connections. Point-7 to Point-9: Finding intra-edges of nodes using cosine semantic similarity scores ≥ 0.7 for retaining symptom-symptom (point-7) and disease-disease (Point-8) pairs and, STRING confidence score ≥ 0.7 for retaining gene–gene pairs. These symptoms, diseases and genes are selected mathematically and statistically as described in point-6. Point-10: Integration of all inter- and intra-edges of symptoms and their allied diseases and genes to construct the TN (symptom-disease-gene) for COVID-19. The representative Venn diagrams indicate the stepwise changes in the number of nodes for the selection of elite symptoms, diseases and genes for the construction of TN.
Finding out the co-expressed genes in the brain of COVID-19 patients using a database
The stepwise approach for finding co-expressed genes in the brain of COVID-19 patients using the NCBI-GEO database is presented in the pictorial diagram (step-1 to step-3 in Fig. 2). Briefly, the RNA-Seq data23 (NCBI-GEO accession ID: GSE164332) of the frontal cortex of the brain of COVID-19 victims (n = 9) and aged-matched healthy controls (n = 7), underwent analysis using geneRecommender algorithm (https://www.bioconductor.org/packages/release/bioc/html/geneRecommender.html) in R software and environment to identify co-expressed genes from the dataset against query genes, i.e., the genes having properties of both hub-bottlenecks and driver nodes evaluated in TN (vide point-4 in methodology). The input data set of the RNA-Seq samples was normalised followed by cross-validation with the leave-one-out method and genes were finally ranked based upon Spearman correlation with query genes using Z-score under geneRecommender analysis. The co-expressed genes were selected using the minet package (https://www.bioconductor.org/packages/release/bioc/html/minet.html) in R-language based on the algorithm for ARACNe (Algorithm for the Reconstruction of Accurate Cellular Networks) (https://rdrr.io/bioc/minet/man/aracne.html) assigning weights of (a) pairwise mutual information (transcriptional gene–gene interaction from expression levels) to genes as nodes and (b) empirical probability (entropy estimators) to its edge with a given threshold value for refining node-pairs.
In silico modelling of ‘combined gene network’ (CGN) for COVID-19
A set of genes including genes as the output of minet analysis (co-expressed genes) and genes as the part of TN, were incorporated as a query in the STRING database using SPPICS > 0.60 as the threshold, to construct a PPI-based CGN (step-4 in Fig. 2). The study was further extended to construct CGNs using different ‘SPPICS’ viz. > 0.70, > 0.80 and > 0.90 as thresholds. The CGNs were developed in Cytoscape software.
Topology analysis of networks to determine ‘hub’, ‘bottleneck’ and ‘driver’ nodes
The centrality measurements of networks were analysed using the CentiScaPe module (http://chianti.ucsd.edu/cyto_web/plugins/index.php) in Cytoscape software to determine ‘hub’ (high degree) and ‘bottleneck’ (high-betweenness/shortest-path) nodes, having higher scores than cut-off values i.e., respective average node degree and average node betweenness scores (for TN: 18.93 and 465.16; for CGN: (1) SPPICS > 0.60: 5.64 and 795.01, (2) SPPICS > 0.70: 4.43 and 644.21, (3) SPPICS > 0.80: 3.56 and 531.32, (4) SPPICS > 0.90: 3.17 and 406.16). These nodes are termed as the ‘date-hubs’ considering their properties as a higher level of the inter-modular connector to coordinate various functional complex modules in a complex biological network24.
The controllability measurements of networks were analysed with the identification of ‘driver nodes’ using the Minimum Driver node Set (MDS) algorithm from the CytoCtrlAnalyser module (https://apps.cytoscape.org/apps/cytoctrlanalyser) of Cytoscape software. The driver nodes control all nodes by receiving the input signals and provide the temporal/dynamic properties of a complex biological network. Driver nodes are classified into (a) ‘indispensable’ i.e., positive control factor, the removal of which increases the total number of driver nodes in the main network, (b) ‘dispensable’ i.e., negative control factor, the removal of which decreases the total driver nodes in the main network and (c) ‘neutral’ control factor, the removal of which does not change the total number of driver nodes in main network25, based on the ability of the nodes to control the main network. Therefore, the network control properties of selected nodes were assessed by the leave-one-out method (% changes of driver nodes after removal of the specific node). The ‘target nodes’ in networks were selected based on their ‘date-hub’ and ‘indispensable-driver’ properties, considering them as the disease candidates25,26.
Gene ontology (GO) based pairwise semantic similarity score (SSS) measurement of ‘target nodes’
The pairwise functional associations of ‘target nodes’ were assessed by calculating SSS in Wang’s GO-BP (biological process) method using the GOSemSim package (http://bioconductor.org/packages/release/bioc/html/GOSemSim.html) in R-language using best-match average (BMA) combination strategy to get the results closer to human expectations27. The pairwise SSS measurements were performed in two separate functional packages namely, (a) ‘mgeneSim’ (https://rdrr.io/bioc/GOSemSim/man/mgeneSim.html) using a list of ‘target genes’ for assessment of ‘direct association’ with score designated as SSS-I, and (b) ‘mclusterSim’ (https://rdrr.io/bioc/GOSemSim/man/mclusterSim.html) using ‘gene-clusters’ (connected genes) against ‘target nodes’ of a network following the top-down approach18, for assessment of ‘indirect association’ with score designated as SSS-II. Further, the classifier statistics ROC-AUC was introduced using the pROC package (https://cran.r-project.org/web/packages/pROC/index.html) in R software and environment to filter out spurious pairwise SSSs for symptoms, diseases and genes considering the accuracy classification as excellent (0.9 < AUC < 1.0), good (0.8 < AUC < 0.9) and weak (AUC < 0.8). The optimal threshold for ROC based on the optimum F1-score and maximum accuracy was considered as a cut-off value for selected pairs of ‘target nodes’ as ‘candidate nodes’.
Functional enrichment analysis of the sets of ‘target genes’ and their connected genes
The functional annotations across several resources including GO-terms (BP:‘biological process’, CC:‘cellular component’, MF:‘molecular function’), ‘KEGG biological pathways’ (https://www.genome.jp/kegg/pathway.html) and disease modules (DisGeNET, Jensen Disease) were analysed in the Enrichr web tool platform (https://maayanlab.cloud/Enrichr/) against the inputs of four different gene-sets viz. (1) Set-1: ‘target genes’ evaluated from TN, (2) Set-2: ‘target genes’ and their connected genes in TN, (3) Set-3: ‘target genes’ evaluated from CGN and (iv) Set-4: ‘target genes’ and their connected genes from CGN. The Set-2 and Set-4 gene-sets were pondered to double-check the overrepresented functional annotation of the respective Set-1 and Set-3 gene-sets. The enriched results (functional annotations) associated with the nervous system were manually curated and selected based on FDR-adjusted p-value < 0.05 as significant terms, including the terms against the ‘candidate genes’. The pairwise SSS-II scores for statistically confident enriched terms were calculated using the mclusterSim function in the GOSemSim package using ‘gene-clusters’ (connected ‘candidate genes’). The classifier statistics ROC-AUC was used to find an accurate classification based on AUC values and select functionally associated Enrichr terms based on the optimal threshold for ROC as a cut-off of SSS-II scores.
Formulation of integrated ‘weighted harmonic mean score’ (WHMS)
The integrated ‘weighted harmonic mean score’ (WHMS) was evaluated using harmonic mean of weightage scores for gene-pairs among ‘target genes’, which appeared to fulfil the criteria of having (a) three individual scores of SPPICS, SSS-I, SSS-II and (b) at least one score with a value above respective threshold (cut-off) level. The ‘accuracy values of ROC’ of SPPICS (WSPPICS), SSS-I (WSSS-I), SSS-II (WSSS-II) were applied as weightage for respective cases following the principle reported28 previously. The formula for integrated WHMS used in the study is given below.
The classifier statistics ROC-AUC and the optimal threshold for ROC as cut-off of WHMS were utilised to obtain the pairs of prevalent ‘candidate genes’ considering them as putative disease-associated genes.
Results
The results found in our study were orderly documented in the flow diagram, with the findings of prevalent ‘candidate genes’ and their links with neurological functional modules in COVID-19 (Fig. 1). The 103 selected literature search identified the different statuses of COVID-19 patients and their 255 ‘neurological symptoms/manifestations’ (Table 1). Further analyses identified the connections of neurological symptoms/manifestations with co-expressed genes that were obtained from RNA-seq data.
Construction of TN using symptoms, diseases and genes
The stepwise construction (Fig. 2) of TN (network density: 0.029, average clustering coefficient:0.108) provided nodes (total 329) and their edges (total 3114) of 92 symptoms, 48 diseases and 189 genes (inset in Fig. 3a).

The model of ‘tripartite network’ (TN) and its ‘target nodes’ with their pairwise semantic similarity scores (SSS) for COVID-19: (a) Inset image: Representation of TN developed in Cytoscape software as described in Fig. 2, with 147 ‘target nodes’ (‘HB + D’, ‘pure-driver’, ‘pure-HB’) including 27 genes (deep grey circles) and categories (different colour codes) of 73 symptoms and 47 diseases, other than ‘target nodes’ (light grey) and all edges (grey). Pictorial image: The connections of only ‘target nodes’ including categories (big circles) of symptoms and diseases in TN, exhibiting details of nodes and edges: triangular (open) inter-links of three gene nodes (ACTB, ADAR, CTNNB1) and respective nodes of 12 symptoms and 11 diseases with same colour codes (for both nodes and edges); other nodes (white-coloured with grey border) without having triangular inter-links and their connections (grey-coloured edges). Both inset and pictorial images: Nodes are represented as different shapes (symptoms:diamond, diseases:rectangle, genes:circle) and sizes (connectivity scores adjusted by the ‘continuous mapping of node size’ in ranges between 25 and 60 pts.) with grey borders (illustrated with 2 pts.). The widths of the edges display respective metrics, which are adjusted by 0.5–2 pts. of ‘continuous mapping of edge width’ in the edge network style of the Cytoscape. (b–e) Heat maps: Representation of the pairwise SSS values (0–1 with colour codes) of ‘target nodes’ of TN including 73 symptoms (b), 47 diseases (c) and 27 genes (d, e). The pairwise SSS measurements (vide ‘Methodology’ section) are calculated as SSS-I for genes (d) and ‘SSS-II for symptoms (b), diseases (c) and genes (e). The columns of heatmaps (b and c) include codes (mentioned right side of each term in a row) of symptoms (b) and diseases (c). The vertical bars (left side of each heat map) demonstrate nodes having three topological properties (different colour codes) of centrality measurements and categories (same colour codes as in ‘inset in a’) of symptoms and diseases of the network. The summary of classifier ROC-AUC statistics (threshold scores, accuracy scores in %, AUC scores) of SSSs (b–e) are presented adjacent to the colour bar.
Finding out the ‘target nodes under TN’ (TG-TN) for symptoms, diseases and genes
The topological assessment on TN evaluated 73 symptoms, 47 diseases and 27 genes (Fig. 3a) under three different properties namely ‘both HB and driver’ (‘HB + D’), ‘pure-driver’, ‘pure-HB’ nodes. Further, the important nodes including 73 ‘target symptoms’ (‘HB + D’:‘pure-driver’:‘pure-HB’ = 16:44:13) and 47 ‘target diseases’ (‘HB + D’:‘pure-driver’:‘pure-HB’ = 8:0:39) were classified into respective six and eight different categories, respectively (Fig. 3a). The 27 TG-TN showed properties (Fig. 3d and e) of ‘HB + D’ (CTNNB1), ‘pure-HB’ (16 genes) and ‘pure-driver’ nodes (10 genes).
Construction of ‘combined gene network’ (CGN) using selected co-expressed genes and TG-TN for COVID-19
Finding out the co-expressed genes and the formation of CGN
Total 225 co-expressed genes were identified from RNA-Seq data and used for the construction of CGN along with 189 genes identified in TN. The stepwise construction (Fig. 4a) of CGN (network density: 0.010, average clustering coefficient:0.169) using a confidence score (SPPICS) > 0.6 provided 281 gene nodes (162 genes from TN including 27 TG-TN) and their 793 edges (Fig. 4b).

The model of ‘combined gene network’ (CGN) and its ‘target nodes’ with their pairwise semantic similarity scores (SSS) for COVID-19: (a) Study design for the construction of the CGN is represented stepwise (point 1–6). (b) The PPI interactome model of CGN is a continuous network consisting of total 281 nodes of gene products/proteins and 793 edges corresponding to the functional connectivities between nodes. The CGN is constructed using SPPICS > 0.60 as the widths of the edges, which are adjusted by 0.5 to 5 pts. of ‘continuous mapping of edge width’ in the edge network style of the Cytoscape. The colour nodes (inset) represent 22 ‘target genes’ having both ‘HB and driver’ properties including five ‘query genes’ derived from TN (green nodes) and 17 ‘co-expressed genes’ (dodger blue) derived from RNA-Seq data of COVID-19 patients. The other nodes of the CGN are kept white-coloured with grey-borders (illustrated with 2 pts.). The sizes of the nodes indicate their connectivities (higher the value, higher will be the size) adjusted by the ‘continuous mapping of node size’ in ranges between 25 and 60 pts. for the lowest and highest node size respectively. (c) The Venn diagrams indicate the changes in number of ‘target genes’ (both ‘HB and driver’) with their names derived from CGNs developed using multiple SPPICS thresholds including > 0.60, > 0.70, > 0.80 and > 0.90 for inclusion of all possible ‘target genes’ for better interpretations. (d and e) Heat maps represent the pairwise SSS values (0–1 with colour codes) of 22 ‘target genes’ of CGN. The values of SSS-I (d) and SSS-II (e) are direct and indirect associations (vide ‘Methodology’ section), respectively. All ‘target genes’ in CGN belong to ‘HB and driver’ topological properties of centrality measurements. The colours of the vertical bars (left side of each heat map) indicate types (vide inset) of ‘target genes’. The summary of classifier ROC-AUC statistics (threshold scores, accuracy scores in %, AUC scores) of SSSs is presented in adjacent to the colour bar.
Evaluation of ‘target genes under CGN’ (TG-CGN)
Collectively, the 22 gene nodes found as ‘HB + D’ from the four different PPI-networks (CGNs) constructed using different confidence scores (SPPICS) viz. > 0.70, > 0.80 and > 0.90 and, were marked as TG-CGN for COVID-19 (Fig. 4c). Interestingly, five genes (ACTB, AKT1, C9orf72, CDON, CTNNB1) out of 22 TG-CGN were found to occur within 14 query genes (green-coloured nodes in Fig. 4b).
Evaluation of pairwise values of SSS for ‘target nodes’
Finding out the pairwise SSS-II values of TG-TN for symptoms and diseases
The 73 symptoms (Fig. 3b) and 47 diseases (Fig. 3c) as TG-TN provided pairwise SSS-II scores for 2628 (73C2) and 1081 (47C2) combinations with their respective six and eight different categories. The 1196 symptom-pairs and 130 diseases-pairs appeared significant based on their respective cut-off values.
Finding out the pairwise values of SSS-I and SSS-II of ‘target genes’
The 27 TG-TN showed 351 (27C2) gene-pairs with SSS-I values (Fig. 3d), and provided 276 (24C2) gene-pairs with SSS-II values (Fig. 3e). The SSS-II calculation did not arise for three gene nodes (ANG, ANXA, C9orf72) because they did not have PPI connections in TN. The 22 TG-CGN genes exhibited 231 (22C2) gene-pairs with both SSS-I (Fig. 4d) and SSS-II values (Fig. 4e) indicating that the 22 genes had connections with other genes in CGN.
Five genes (green-coloured nodes in Fig. 4b), common in both networks (TN and CGN), showed their pairwise unique SSS-I (Figs. 3d and 4d) values irrespective of the networks. The gene-pairs of TGs with SSS-I (Figs. 3d and 4d) and SSS-II (Figs. 3e and 4e) scores above their respective cut-off values were selected as statistically significant once under both networks (TN and CGN). In TG-TN, 20 gene-pairs were common among selected gene-pairs having significant SSS-I (31 gene-pairs, Fig. 3d) and SSS-II (81 gene-pairs, Fig. 3d) values. In CGN, 33 gene-pairs were common among selected gene-pairs having significant SSS-I (33 gene-pairs, Fig. 4d) and SSS-II (143 gene-pairs, Fig. 4e) values. Among the statistically selected common gene-pairs of TGs, nine in TN and 13 in CGN showed physical PPI interactions with SPPICS values (Table 2) in their respective networks. Interestingly, the PPI link viz. AKT1-CTNNB1 was evident in both TN and CGN (Figs. 3a and 4b, Table 2). Therefore, 21 gene-pairs (eight from TN, 12 from CGN, one common for both networks) exhibiting SSS-I, SSS-II and SPPICS values, were designated as ‘candidate genes’ pairs for COVID-19 (Fig. 5f).

The ‘candidate genes’ and their functional modules for neurological manifestations of COVID-19: (a) Bubble plot: Results of Enrichment analysis against four sets of genes (‘target genes’ and their connected genes), exhibiting nervous system-specific functional annotations/terms (X-axis) across six resources, characterised by ‘gene count’ (size of bubbles adjusted with 0.5 to 4 pts.), ‘combined score’ (log(p-value) × z-value > 147 adjusted in VIBGYOR colour gradient of bubbles) and corresponding ‘gene ratio’ (Y-axis). (b) Box plot: Data (X-axis) of interaction score types (Y-axis) i.e., SSS-I, SSS-II, SPPICS and WHMS of ‘candidate genes’. (c) Checkerboard: ‘Candidate genes’ (Y-axis) with their status of topological properties in networks (vertical bars), associated with enriched 54 functional annotation terms (X-axis) evaluated under six different ontology categories (horizontal bar) manually curated from results of the bubble plot (a). (d) Heat map: Pairwise GO-BP SSS-II values (0.23–1.0 with colour codes) of 40 enriched terms with their categories (colours in horizontal bar), overrepresented with at least one ‘candidate gene’. (e) Box plot: Data of % changes (Y-axis) of topological properties (X-axis) in CGN using leave-one-out method by ‘candidate genes’ to cross-validate disease-causing ‘indispensable’ driver nodes in the network. (f) Pictorial presentation (developed in Cytoscape software): the interactome model of 21 ‘candidate genes’ and their associated functional seven categories of Enrichr terms related to neurological manifestations of COVID-19. Lines represent gene-pair interactions (solid lines: width as WHMS adjusted by 3–10 pts.) with the ‘prevalent’ links (dark solid lines) of ‘candidate genes’ having WHMS more than cut-off values (given in b) and functional links (dotted lines: width adjusted by 2 pts.) of genes with categories (given in d) of Enrichr terms. [Box plot (b and e) summary: Data with quartile values (edges of box), inter-quartile range, median value (black vertical line inside box), mean value (grey-coloured filled circle in box), maximum and minimum values (two vertical lines), and their out layers; Classifier statistics (ROC-AUC) summary: optimal threshold score(accuracy score)AUC score (vide: right side of box plots in b; adjacent to the colour bar in d); Codes of Enrichr annotation terms (c and d): ‘D15,D22,D23(a)’ and ‘D15,D22,D23(b)’ as ‘Lateral sclerosis’ and ‘Amyotrophic lateral sclerosis’ respectively.]
Selection and categorisation of ‘candidate gene’ pairs by the formulation of WHMS
The selected 21 ‘candidate genes’ with their pairwise 21 interactions showed excellent (AUC > 0.90) classifications based on interaction values of SSS-I, SSS-II and SPPICS. The interaction values showed the same accuracy score of 0.86, and this score was used as weightage for respective case to calculate integrated WHMS of interactions of the ‘candidate genes’. Considering statistical accuracy (95%) and excellent classification with the highest AUC value (0.97), the values of WHMS of ‘candidate genes’ pairs were considered a better choice for further analysis (Fig. 5b and Table 2). The six pairwise interactions (ADAM10-ADAM17, AKT1-CTNNB1, AKT1-ESR1, AKT1-PIK3CA, CTNNB1-ESR1, FGFR1-PIK3CA) of ‘candidate genes’ showed WHMS values (Table 2) greater than the cut-off value (0.57) for WHMS (Fig. 5b) and were considered as prevalent pairs-wise interactions of the ‘candidate genes’ that were associated with functional aspects in COVID-19 (dark solid edges in Fig. 5f). Notably, these interactions of prevalent ‘candidate genes’ had values of SSS-I, SSS-II and SPPICS greater than their respective cut-off values (Fig. 5b and Table 2). The remaining 15 pairwise interactions of ‘candidate genes’ (non-prevalent) showed WHMS values below the cut-off value (Table 2, light solid edges in Fig. 5f). Few of them exhibited values of SSS-I, SSS-II and SPPICS below the respective cut-off values. Notably, 21 pairwise ‘candidate genes’ presented SSS-I values greater than the cut-off (0.40) value (Table 2).
Enrichr analysis of ‘target genes’ and Integration of annotation terms
Enrichr annotation of four sets of genes with ‘target genes’ (set-1 for TG-TN and set-3 for TG-CGN) and their connected genes (set-2 and set-4), gave off statistically significant a total of 159 terms (data not shown) including several common terms among four sets. The statistically significant (FDR-adjusted p-value < 0.05) Enrichr annotation terms were further cross-validated manually with selected (above cut-off values of SSS-II) ‘target nodes’ of the symptoms (Fig. 3b) and diseases (Fig. 3c) found in TN analysis. 13 terms (two symptoms,11 diseases) were common (Fig. 5a) among annotations under (i) DisGeNET (four diseases, one symptom), (ii) Jensen disease (six diseases, one symptom) (iii) KEGG pathway (one disease). The rest of the total terms showed selected 41 terms (Fig. 5a) associated with functional annotations of the nervous system, including 11 in DisGeNET (T1-T11), six in GO-BP (T12-T17), nine in GO-CC (T18-T26), seven in GO-MF (T27-T33), five in Jensen Disease (T34-T38) and three in KEGG pathway (T39-T41). Therefore, 54 (13 + 41) selected terms were implied to discover their functional links with ‘candidate genes’ in subsequent analysis.
Finding out the functional annotations of ‘candidate genes’ and their categorisation
The selected 40 functional annotation terms against 21 ‘candidate genes’ (Fig. 5c), provided 780 pairwise (40C2) SSS-II values (Fig. 5d) and showed an accurate (75%) and good classification (AUC:0.83) with 330 SSS-II values above the cut-off value (0.64). These terms were categorised in to seven different functional modules (‘Behaviour & Cognitive disorder’, ‘Cellular Signaling pathways’, ‘CNS tumour/cancer’, ‘Motor dysfunction’, ‘Neurodegenerative disorders’, ‘Neurodevelopmental diseases’, ‘Neuron and astrocyte cellular’), comparing with functional modules categorised for symptoms and diseases in TN (Figs. 3b and 3c). Interestingly, six pairwise terms appeared to be common among statistically significant terms under (a) enriched for ‘candidate genes’ (Fig. 5d) and (b) ‘target nodes’ for symptoms/diseases under TN (Figs. 3b, 3c) and, presented greater (% more) pairwise SSS-II values with ‘candidate genes’ viz. atrophy-aphasia (3.7%) as symptom-pair and other five disease-pairs including (a) ‘progressive non-fluent aphasia’ with ‘classic progressive supranuclear palsy syndrome’ (15%), ‘amyotrophic lateral sclerosis’ (32.5%), ‘frontotemporal dementia’ (17.7%) and (b) ‘frontotemporal dementia’ with ‘amyotrophic lateral sclerosis’ (8.6%) and ‘progressive supranuclear palsy syndrome’ (17.2%).
Finding out the essentiality of ‘candidate genes’
Cross-validation (leave-one-out method) of 21 ‘candidate genes’ resulted in a 3.15% average reduction in ‘HB + D’ node and average increases in 7.96% and 4.81% of ‘pure-driver’ and ‘total driver’ nodes respectively, in CGN network (Fig. 5e). The results signified the 21 ‘candidate genes’ as ‘indispensable’ driver nodes that were practically regulatory genes associated with neurological diseases in COVID-19.
Assimilation of ‘candidate genes’ with functional annotations to develop brain-related functional modules
The 21 ‘candidate genes’, their 21 interactions having WHMS (Table 2) and links with corresponding functional annotations (Fig. 5c) under different categories (Fig. 5d) are represented in a pictorial diagram (Fig. 5f) for better interpretations. The seven prevalent ‘candidate genes’ (ADAM10, ADAM17, AKT1, CTNNB1, ESR1, FGFR1, PIK3CA) showed direct associations with enriched terms under the categories of ‘Neurodegenerative disorders’, ‘Neurodevelopmental diseases’, ‘CNS tumour/cancer’ and ‘Cellular Signaling pathways’. Their indirect associations with enriched terms under the categories of ‘Neuron and astrocyte cellular’ events, ‘Behaviour & Cognitive disorder’ and ‘Motor dysfunction’ appeared to have interactions with non-prevalent ‘candidate genes’ (Fig. 5f).
Discussion
The present study is a novel approach of integrated network-based multiple computational analyses of two networks, viz. TN and CGN to find the ‘disease-related regulatory genes’ associated with functional (transcriptional and translational) cellular entities necessary for understanding the molecular basis of brain pathophysiological phenotypes of COVID-19. To achieve the goal, we proceeded with the most robust approaches through multiple screening steps including (a) finding the two sets of predictive ‘target genes’, evaluated from TN and CGN with their PPIs having STRING ‘combined scores’ (SPPICS) as priori analysis, (b) evaluation of functional associations by ‘semantic similarity scores’ (SSS) of two sets of ‘target genes’, (c) screening ‘target genes’ by cumulating PPIs having both STRING-CS and SSS by selection with given threshold values for respective PPI scores to find ‘candidate genes’, (d) formulating integrated scores (WHMS) combining SPPICS and SSS for giving weightage to PPIs of ‘candidate genes’ for further categorisation, (e) assimilation of ‘annotation terms’ (symptoms/diseases) with genes among ‘candidate nodes’ through posteriori enrichment analysis to get functional module. Notably, ‘target nodes’ for symptoms and diseases evaluated from TN were manually curated and integrated with suitable Enrichr annotations for better interpretation. The classification statistics (ROC-AUC) and cut-off values (optimal thresholds for ROC) identified the PPIs with their association scores (SPPICS, SSS, WHMS) for the respective steps most accurately (AUC > 0.8) with minimum false positive interpretation. Furthermore, all 21 ‘candidate genes’ appeared co-expressive. They became almost equally ‘indispensable’ after screening for their controllability property on CGN. Finally, the ‘candidate genes’ were categorised based on pairwise analysis of values of WHMS, SSS and SPPICS to find prevalent vs. non-prevalent ‘candidate genes’ with their pattern (‘is_a’ vs ‘part_of’) of relationship with neurological manifestations in COVID-19. The pathophysiological relevance of prevalent ‘candidate genes’ with COVID-19 has been discussed thoroughly.
In our study, two networks (TN (Fig. 3a) and CGN (Fig. 4b)) were analysed to find the ‘target nodes’, which satisfied the three properties, viz. ‘hub’, ‘bottlenecks’ and ‘driver’ together for COVID-19. Separate studies indicate that host proteins targeted by viral proteins show the node properties of hubs and high-betweenness centrality25 and, ‘indispensable’ driver controllability25,26 in a host protein network. The ‘target genes’ (TG) evaluated from TN (TG-TN) showed node properties of hub-bottleneck (HB or ‘date-hubs’ i.e., together hub and bottlenecks), driver and both (HB and driver) (Fig. 3d and e). All ‘target genes’ (TG) evaluated from CGN (TG-CGN) showed node properties as both HB and driver (Fig. 4b and c). In fact, the number of driver nodes compared to the driver nodes themselves appears crucial for maintenance of the controllability of a network25,26. In our study, the finally selected 21 ‘candidate genes’ appeared to be ‘indispensable’ as the number of driver nodes increased (4.81% for total drivers, 7.96% for drivers but non-hub-bottlenecks i.e., ‘pure-drivers’) in the CGN after removal of one of the ‘candidate genes’ (Fig. 5e).
Next, the SPPICS were applied to construct possible PPI connections of new genes in TN (Fig. 3a) and CGN (Fig. 4b) networks related to the brain in COVID-19. The SPPICS provides quantitative measurement of physical and functional PPI evidence derived from available online resources. It lacks experimental evidences of functional entities related to regulatory mechanism in physiological context of cells, as part of its calculation. The Gene Ontology resources provide a model of hierarchically (ancestors-descendants relationship) organised directed acyclic graph (DAG) having GO-terms as nodes and functional association as directed edges within each hierarchy by ‘is_a’ (subtype) and ‘part_of’ (component) relationships associated with gene/protein functionality (molecular function, cellular component and biological process) description. GO-based biological process (GO-BP) provides cohesive evidences on protein interactions, related to both physical and functional networks of molecular events in cellular physiology27. The ‘candidate genes’ for a disease show common biological pathway(s)18. Therefore, in our study, the functional associations among ‘target nodes’ were analysed by semantic comparison of GO-BP annotations quantitatively through computing similarities between gene-pairs (SSS-I measurement) (Figs. 3d and 4d) and clustering gene/symptoms/disease/module-pairs (SSS-II measurement) into known pathways (Figs. 3b, c, e, 4e and 5d).
The conventional SSS-I provided pairwise ‘direct association’ based on comparative assessment of associated GO-BP terms of two ‘target genes’ (Figs. 3d and 4d). It has been reported that the genes and their functionally connected co-expressive genes show tissue-specific expressions and regulations, and exhibit pleiotropic effects, i.e., sharing common symptoms and diseases29,30. Based on this concept, the estimation of SSS-II values was newly introduced in our study (Figs. 3e and 4e). The SSS-II values provided pairwise ‘indirect association’ based on the summated contribution of comparative assessment of associated GO-BP terms of gene-clusters (connected genes) against targeted gene-pairs. Our data indicated that the classification of both SSS-I and SSS-II values were statistically robust (AUC: 0.91 and 0.93) with the different range of values and had respective accurate (0.40 and 0.71) threshold values for ROC to interpret the results most stringently (Fig. 5b). Interestingly, the gene-pairs found as common PPI in TN and CGN networks showed the same values of SSS-I whereas SSS-II values varied for networks. For example, CTNNB1-AKT1 gene-pair among ‘target genes’, found as common PPI in both TN (Fig. 3a) and CGN (Fig. 4b), showed equal SSS-I value (0.487) (Figs. 3d and 4d). The SSS-II values of this gene-pair varied for TN (0.783) and CGN (0.805) (Figs. 3e and 4e). Additionally, certain gene-pairs having considerable (above a threshold value) SSS-I values appeared to have low (below a threshold value) or zero (‘null functional similarity’) SSS-II values, including AKT1-FGFR1 (SSS-I: 0.485—above threshold; (Fig. 3d), SSS-II: 0.69—below the threshold; (Fig. 3e)), C9orf72-SQSTM1 (SSS-I: 0.462—above threshold; (Fig. 3d), SSS-II: 0; (Fig. 3e)). Therefore, the gene-pairs with significant values of both SSS-I and SSS-II were considered for better interpretation of the results in our study.
Irrespective of the network, the SSS-I values of gene-pairs/PPIs might depict the global and existing ‘is_a’ and/or ‘part_of’ semantic similarity available in the GO-BP annotation data and therefore would remain the same for representing generalised pathophysiological functions for any disease condition. Alternatively, the SSS-II values for gene-pairs varied due to different constituents in ‘gene-clusters’, which provided the ‘is_a’ and/or ‘part_of’ functional relationship by sharing common GO-BP annotation terms to reflect the discrete or pleiotropic effects of genes among networks (Table 2). Particularly, the zero value of SSS-II of a gene-pair indicated that ‘gene-clusters’ (connected genes) against the gene-pair had not been well-supported by current literature-based evidences related to COVID-19 neurological symptoms. Therefore, the SSS-II values might provide a better disease-specific metric for the event of disassembly in the homeostatic genetic connectivity that gets perturbed during COVID-19 insult.
The better quality of the PPI network improves the prediction accuracy to determine the ‘candidate genes’ for a disease. The STRING database comprises genes from prior knowledge and thereby provides a PPI model with certain limitations. The SSS-based PPI network includes genes having sufficient annotation information and so has GO annotation biasness. The integration of two scores, viz. SPPICS of STRING-based PPI network and SSS of anatomy-based gene network by introducing ‘accuracy values of ROC’ as weightage given to the respective scores followed by summation of them, is reported to develop the better quality of network by filtering out the false positive interactions28. In our study, the same principle of weightage (‘accuracy value of ROC’) was applied to evaluate the weighted scores of SPPICS, SSS-I, SSS-II followed by calculating their harmonic mean in order to evolve the integrated scores (WHMS) for those gene-pairs which satisfied the criteria of having (a) three individual scores (SPPICS, SSS-I, SSS-II) and (b) at least one score with value above respective threshold level (Fig. 5b). The integrated scores of total 21 gene-pairs showed statistically strong fitted (AUC > 0.9) and most accurate (95%) interactions (Fig. 5b and solid edges in Fig. 5f), and provided 21 ‘candidate genes’ (Fig. 5c and f) associated with neurological insults (Fig. 5f) in COVID-19. All 21 ‘candidate genes’ (Fig. 5c) appeared to be derived from RNA-Seq data (Fig. 4b) and thus considered as co-expressed genes of COVID-19 in the brain.
All 21 gene-pairs/PPIs of ‘candidate genes’ showed SSS-I values (Figs. 3d, 4d, vide Point 4.2 in the results section) above the respective threshold value and therefore represented as ‘is_a’ functional relationship (Table 2) in the semantic similarity of GO-BP annotations for generalised pathophysiological functions irrespective of disease. Based on the threshold value of integrated PPI scores (WHMS), 21 pairwise ‘candidate genes’ were classified as ‘prevalent’ and ‘non-prevalent’ ‘candidate genes’ (Table 2). Six pairs of seven ‘prevalent’ ‘candidate genes’ showed strong database-dependent putative interaction scores (SPPICS) (Figs. 3a and 4b) and subsequently satisfied SSS-II values (Figs. 3e and 4e) above the threshold levels representing ‘is_a’ relationship (Table 2) with neuro-pathological manifestations in COVID-19. The ‘non-prevalent’ ‘candidate genes’ found to have varied SPPICS scores (strong and weak) and different relationships (‘is_a’ and ‘part-of’) among their gene-pairs (Table 2). The ‘prevalent’ ‘candidate genes’ (ADAM10, ADAM17, AKT1, CTNNB1, ESR1, FGFR1, PIK3CA) might have the most prominent pathophysiological relevance in COVID-19.
The pathophysiological action of SARS-CoV-2 in brain tissue cells begins with its binding to ACE2 receptors of the cell membrane. After viral endocytosis is over, ADAM17 directs the shedding of the ectodomain of the receptors31 and enhances the formation of TNF-α leading to escalation of the cytokine storm1. Dysfunction of ADAMs can also exacerbate Alzheimer’s disease condition through the misfolded Aβ pathology32, ischaemic stroke33 and vascular thrombosis34 via ACE2 and TNF-α receptors. Recently, ADAM10 and ADAM17 have been marked as the risk factors for cerebral infarction and hippocampal sclerosis related epilepsy35, respectively. In diabetic patients, an elevated activity of ADAM17 is found to enhance COVID-19 susceptibility36 through the AKT1-mediated pathway.
AKT1 encodes protein kinase B, which is a part of the PI3K-NFκβ signalling pathway, involved in aberrant expression of IL10 and inflammation in severe coronavirus infection32. AKT1 can induce tumour formation through the upregulation of RNA binding protein EIF4G137, coronavirus exit from endosomes via valosin-containing protein VCP38 and MAPT-associated tau protein formation in dementia-like cognitive impairment39. The altered AKT1-signalling pathway is also evident in ATM-associated autism spectrum disorders that may exaggerate COVID-1940.
CTNNB1 expresses β-catenin related to the Wnt-signalling pathway and gets downregulated in COVID-1941 through the activation of glycogen synthase kinase 3β in the prefrontal cortex and dorsal hippocampus42. Defects in the formation of β-catenin cause disruption of the blood–brain barrier43 leading to the development of cerebrovascular thrombosis44, headache45, stroke46 and epileptic seizure47 during or in the aftermath of COVID-19. Stress-induced Dickkopf-1 protein formation prevents CTNNB1 gene function in the hippocampus, thereby impairing memory48. Uncontrolled interactions of CTNNB1 with PSEN149 and GLI250 are linked to skin tumorigenesis, which may be suggestive for their possible involvement in COVID-19. Moreover, abnormalities in PSEN151 and GLI252 functions, associated with the CTNNB1 gene are likely to be implicated in developing Alzheimer’s disease- and holoprosencephaly-like features in COVID-19.
ESR1 gene encodes estrogen receptor 1 that occurs primarily in the medial preoptic area and ventromedial nucleus of the hypothalamus, which regulates diverse reproductive functions of both males and females53. ESR1 deems to share CTNNB1-54 and AKT1-55 mediated signalling pathways to accelerate cancer and neurodegeneration, respectively. Moreover, estrogen inhibits inflammation and immune responses in COVID-19 and reduces the COVID-19 susceptibility in females than in males, because of its higher concentration and a greater number of ESR1 receptors in target tissues56.
In the adult brain, the PIK3CA gene product PI3K via the AKT1-pathway may exaggerate neurodegeneration in Alzheimer’s disease57, and FGFR1 dysregulation leads to ischemic stroke58 and holoprosencephaly59. Moreover, synchronised PIK3CA mutation and FGFR1 alteration are associated with ESR1-positive breast cancer60. Since COVID-19 develops inflammatory burst and lymphopenia, SARS-CoV-2-associated illness therefore may aggravate cancer prognosis59.
Notably, two prevalent genes CTNNB1 and AKT1 appeared to be common for both TN (Fig. 3a) and CGN (Fig. 4b). Both genes showed SSS-II (network-specific semantic similarity score) values greater than threshold values in respective cases (Figs. 3e and 4e), and therefore functionally interlinked (Fig. 5f). CTNNB1 appeared as the lone gene having both HB and driver node properties in TN. Interestingly, CTNNB1 was the only gene which formed a ‘tripartite open network’ that linked with eight symptoms and those symptoms remained connected with eight diseases (Fig. 3a). CTNNB1 in TN got connections with (a) five symptoms (viz. cerebral ischemia, vascular thrombosis, intracranial hypertension, seizures and epileptic seizures) in the central nervous system (CNS), (b) two symptoms (viz. hypertonia and fatigue) in the peripheral nervous system (PNS) and (c) one psychiatric symptom (viz. behavioral disorder). Moreover, it demonstrated that three symptoms connected with CTNNB1 in the present tripartite network, also happened to occur in other diseases, coinfected with COVID-19, viz. (a) cerebral ischemia in alobar, lobar and semilobar holoprosencephaly, Behçet disease, early infantile epileptic encephalopathy, MELAS and meningioma; (b) vascular thrombosis in alobar, lobar and semilobar holoprosencephaly, amyotrophic lateral sclerosis and MELAS; (c) intracranial hypertension in MELAS. But no data is available yet about the rest of the five symptoms in any other diseases challenged none-ever with SARS-CoV-2. This suggests that certain neurological symptoms of COVID-19 are intermingled with other diseases and need special clinical attention.
In conclusion, the present study, however, suffers from two limitations regarding the (a) status of COVID-19 patients who had mixed implications of neurological symptoms/manifestations during hospitalisation in most cases, long-term reports in few cases and without having any detail in other cases as reported in the literature (Table 1), and (b) use of a small cohort of a transcriptomic dataset of patients having SARS-CoV-2 viruses in brain autopsy samples23, available only at the time of study period.
Data availability
All data are available in the paper.
References
Wang, Y., Wang, Y., Chen, Y. & Qin, Q. Unique epidemiological and clinical features of the emerging 2019 novel coronavirus pneumonia (COVID-19) implicate special control measures. J. Med. Virol. 92, 568–576. https://doi.org/10.1002/jmv.25748 (2020).
Hoffmann, M. et al. SARS-CoV-2 cell entry depends on ACE2 and TMPRSS2 and is blocked by a clinically proven protease inhibitor. Cell 181, 271-280.e8. https://doi.org/10.1016/j.cell.2020.02.052 (2020).
Chen, R. et al. The spatial and cell-type distribution of SARS-CoV-2 receptor ACE2 in the human and mouse brains. Front. Neurol. 11, 573095. https://doi.org/10.3389/fneur.2020.573095 (2021).
Douaud, G. et al. SARS-CoV-2 is associated with changes in brain structure in UK Biobank. Nature 604, 697–707. https://doi.org/10.1038/s41586-022-04569-5 (2022).
Wenzel, J. et al. The SARS-CoV-2 main protease Mpro causes microvascular brain pathology by cleaving NEMO in brain endothelial cells. Nat. Neurosci. 24, 1522–1533. https://doi.org/10.1038/s41593-021-00926-1 (2020).
Meinhardt, J. et al. Olfactory transmucosal SARS-CoV-2 invasion as a port of central nervous system entry in individuals with COVID-19. Nat. Neurosci. 24, 168–175. https://doi.org/10.1038/s41593-020-00758-5 (2021).
Guadarrama-Ortiz, P. et al. Neurological aspects of SARS-CoV-2 infection: Mechanisms and manifestations. Front. Neurol. 11, 1039. https://doi.org/10.3389/fneur.2020.01039 (2020).
Lima, M. et al. Unraveling the possible routes of SARS-COV-2 invasion into the central nervous system. Curr. Treat. Options Neurol. 22, 37. https://doi.org/10.1007/s11940-020-00647-z (2020).
Solomon, T. Neurological infection with SARS-CoV-2—the story so far. Nat. Rev. Neurol. 17, 65–66. https://doi.org/10.1038/s41582-020-00453-w (2021).
Boroujeni, M. E. et al. Inflammatory response leads to neuronal death in human post-mortem cerebral cortex in patients with COVID-19. ACS Chem. Neurosci. 12, 2143–2150. https://doi.org/10.1021/acschemneuro.1c00111 (2021).
Mahalaxmi, I., Kaavya, J., Mohana-Devi, S. & Balachandar, V. COVID-19 and olfactory dysfunction: A possible associative approach towards neurodegenerative diseases. J. Cell. Physiol. 236, 763–770. https://doi.org/10.1002/jcp.29937 (2021).
Chou, S. H. Y. et al. Global Incidence of neurological manifestations among patients hospitalized with COVID-19-A report for the GCS-NeuroCOVID consortium and the ENERGY consortium. JAMA Netw. Open 4, e2112131. https://doi.org/10.1001/jamanetworkopen.2021.12131 (2021).
Taquet, M., Geddes, J. R., Husain, M., Luciano, S. & Harrison, P. J. 6-month neurological and psychiatric outcomes in 236 379 survivors of COVID-19: A retrospective cohort study using electronic health records. Lancet Psychiat. 8, 416–427. https://doi.org/10.1016/S2215-0366(21)00084-5 (2021).
Nepal, G. et al. Neurological manifestations of COVID-19: A systematic review. Crit. Care 24, 421. https://doi.org/10.1186/s13054-020-03121-z (2020).
Vitalakumar, D., Sharma, A., Kumar, A. & Flora, S. J. S. Neurological manifestations in COVID-19 patients: A meta-analysis. ACS Chem. Neurosci. 12, 2776–2797. https://doi.org/10.1021/acschemneuro.1c00353 (2021).
Prasad, K., AlOmar, S. Y., Alqahtani, S. A. M., Malik, M. Z. & Kumar, V. Brain disease network analysis to elucidate the neurological manifestations of COVID-19. Mol. Neurobiol. 58, 1875–1893. https://doi.org/10.1007/s12035-020-02266-w (2021).
Wu, Q., Coumoul, X., Grandjean, P., Barouki, R. & Audouze, K. Endocrine disrupting chemicals and COVID-19 relationships: A computational systems biology approach. Environ. Int. 157, 106232. https://doi.org/10.1016/j.envint.2020.106232 (2020).
Halu, A., De Domenico, M., Arenas, A. & Sharma, A. The multiplex network of human diseases. NPJ Syst. Biol. Appl. 5, 15. https://doi.org/10.1038/s41540-019-0092-5 (2019).
Sepehrinezhad, A., Rezaeitalab, F., Shahbazi, A. & Sahab-Negah, S. A computational-based drug repurposing method targeting SARS-CoV-2 and its neurological manifestations genes and signaling pathways. Bioinform. Biol. Insights. 15, 11779322211026728. https://doi.org/10.1177/11779322211026728 (2021).
Pesta, B., Fuerst, J. & Kirkegaard, E. O. W. Bibliometric keyword analysis across seventeen years (2000–2016) of intelligence articles. J. Intell. 6, 46. https://doi.org/10.3390/jintelligence6040046 (2018).
Deng, L., Ye, D., Zhao, J. & Zhang, J. MultiSourcDSim: An integrated approach for exploring disease similarity. BMC Med. Inf. Decis. Mak. 19, 269. https://doi.org/10.1186/s12911-019-0968-8 (2019).
Zhou, X., Menche, J., Barabási, A. L. & Sharma, A. Human symptoms–disease network. Nat. Commun. 5, 4212. https://doi.org/10.1038/ncomms5212 (2014).
Gagliardi, S. et al. Detection of SARS-CoV-2 genome and whole transcriptome sequencing in frontal cortex of COVID-19 patients. Brain Behav. Immun. 97, 13–21. https://doi.org/10.1016/j.bbi.2021.05.012 (2021).
Chang, X., Xu, T., Li, Y. & Wang, K. Dynamic modular architecture of protein-protein interaction networks beyond the dichotomy of ‘date’ and ‘party’ hubs. Sci. Rep. 3, 1691. https://doi.org/10.1038/srep01691 (2013).
Ravindran, V. et al. Network controllability analysis of intracellular signalling reveals viruses are actively controlling molecular systems. Sci. Rep. 9, 2066. https://doi.org/10.1038/s41598-018-38224-9 (2019).
Loscalzo, J. & Barabási, A. L. Systems biology and the future of medicine. Wiley Interdiscip. Rev. Syst. Biol. Med. 3, 619–627. https://doi.org/10.1002/wsbm.144 (2011).
Dessimoz, C. & Škunca, N. The Gene Ontology handbook. Methods Mol. Biol. 1446, 1–302. https://doi.org/10.1007/978-1-4939-3743-1 (2017).
Fernando, P. C., Mabee, P. M. & Zeng, E. Integration of anatomy ontology data with protein-protein interaction networks improves the candidate gene prediction accuracy for anatomical entities. BMC Bioinform. 21, 442. https://doi.org/10.1186/s12859-020-03773-2 (2020).
Chavali, S., Barrenas, F., Kanduri, K. & Benson, M. Network properties of human disease genes with pleiotropic effects. BMC Syst. Biol. 4, 78. https://doi.org/10.1186/1752-0509-4-78 (2010).
van Dam, S., Võsa, U., van der Graaf, A., Franke, L. & de Magalhães, J. P. Gene co-expression analysis for functional classification and gene-disease predictions. Brief. Bioinform. 19, 575–592. https://doi.org/10.1093/bib/bbw139 (2018).
Schreiber, B., Patel, A. & Verma, A. Shedding light on COVID-19: ADAM17 the missing link?. Am. J. Ther. 28, e358–e360. https://doi.org/10.1097/MJT.0000000000001226 (2021).
Qian, M., Shen, X. & Wang, H. The distinct role of ADAM17 in APP proteolysis and microglial activation related to alzheimer’s disease. Cell. Mol. Neurobiol. 36, 471–482. https://doi.org/10.1007/s10571-015-0232-4 (2016).
Wang, H. et al. ADAM17 participates in the protective effect of paeoniflorin on mouse brain microvascular endothelial cells. J. Cell. Physiol. 233, 9320–9329. https://doi.org/10.1002/jcp.26308 (2018).
Bernard, I., Limonta, D., Mahal, L. K. & Hobman, T. C. Endothelium infection and dysregulation by SARS-CoV-2: Evidence and caveats in COVID-19. Viruses 13, 29. https://doi.org/10.3390/v13010029 (2020).
Dixit, A. B. et al. Integrated genome-wide DNA methylation and RNAseq analysis of hippocampal specimens identifies potential candidate genes and aberrant signalling pathways in patients with hippocampal sclerosis. Neurol. India 68, 307–313. https://doi.org/10.4103/0028-3886.280649 (2020).
Stepanova, G. Biologia Futura: Is ADAM 17 the reason for COVID-19 susceptibility in hyperglycemic and diabetic patients?. Biol. Futura 72, 291–297. https://doi.org/10.1007/s42977-021-00092-2 (2021).
Lim, H. J., Crowe, P. & Yang, J. L. Current clinical regulation of PI3K/PTEN/Akt/mTOR signalling in treatment of human cancer. J Cancer Res. Clin. Oncol. 141, 671–689. https://doi.org/10.1007/s00432-014-1803-3 (2015).
Wong, H. H. et al. Genome-wide screen reveals valosin-containing protein requirement for coronavirus exit from endosomes. J. Virol. 89, 11116–11128. https://doi.org/10.1128/JVI.01360-15 (2015).
Zhou, Y. et al. Network medicine links SARS-CoV-2/COVID-19 infection to brain microvascular injury and neuroinflammation in dementia-like cognitive impairment. Alzheimers Res. Ther. 13, 110. https://doi.org/10.1186/s13195-021-00850-3 (2021).
Pizzamiglio, L. et al. The DNA repair protein ATM as a target in autism spectrum disorder. JCI Insight 6, e133654. https://doi.org/10.1172/jci.insight.133654 (2021).
Vastrad, B., Vastrad, C. & Tengli, A. Bioinformatics analyses of significant genes, related pathways, and candidate diagnostic biomarkers and molecular targets in SARS-CoV-2/COVID-19. Gene Rep. 21, 100956. https://doi.org/10.1016/j.genrep.2020.100956 (2020).
Xu, L. Z. et al. BDNF-GSK-3β-β-catenin pathway in the mPFC Is involved in antidepressant-like effects of morinda officinalis oligosaccharides in rats. Int. J. Neuropsychopharmacol. 20, 83–93. https://doi.org/10.1093/ijnp/pyw088 (2017).
Fosse, J. H., Haraldsen, G., Falk, K. & Edelmann, R. Endothelial cells in emerging viral infections. Front. Cardiovasc. Med. 8, 619690. https://doi.org/10.3389/fcvm.2021.619690 (2021).
Fu, Y., Cheng, Y. & Wu, Y. Understanding SARS-CoV-2-mediated inflammatory responses: From mechanisms to potential therapeutic tools. Virol. Sin. 35, 266–271. https://doi.org/10.1007/s12250-020-00207-4 (2020).
Wu, Y. et al. Nervous system involvement after infection with COVID-19 and other coronaviruses. Brain Behav. Immun. 87, 18–22. https://doi.org/10.1016/j.bbi.2020.03.031 (2020).
Cappuccio, I. et al. Induction of Dickkopf-1, a negative modulator of the Wnt pathway, is required for the development of ischemic neuronal death. J. Neurosci. 25, 2647–2657. https://doi.org/10.1523/JNEUROSCI.5230-04.2005 (2005).
Theilhaber, J. et al. Gene expression profiling of a hypoxic seizure model of epilepsy suggests a role for mTOR and Wnt signaling in epileptogenesis. PLoS ONE 8, e74428. https://doi.org/10.1371/journal.pone.0074428 (2013).
Matrisciano, F. et al. Induction of the Wnt antagonist Dickkopf-1 is involved in stress-induced hippocampal damage. PLoS ONE 6, e16447. https://doi.org/10.1371/journal.pone.0016447 (2011).
Xia, X. et al. Loss of presenilin 1 is associated with enhanced beta-catenin signaling and skin tumorigenesis. Proc. Natl. Acad. Sci. USA 98, 10863–10868. https://doi.org/10.1073/pnas.191284198 (2001).
Pantazi, E. et al. GLI2 is a regulator of β-catenin and is associated with loss of E-cadherin, cell invasiveness, and long-term epidermal regeneration. J. Invest. Dermatol. 137, 1719–1730. https://doi.org/10.1016/j.jid.2016.11.046 (2017).
Roessler, E. et al. Loss-of-function mutations in the human GLI2 gene are associated with pituitary anomalies and holoprosencephaly-like features. Proc. Natl. Acad. Sci. USA 100, 13424–13429. https://doi.org/10.1073/pnas.2235734100 (2003).
Dahlin, A. M. et al. CCND2, CTNNB1, DDX3X, GLI2, SMARCA4, MYC, MYCN, PTCH1, TP53, and MLL2 gene variants and risk of childhood medulloblastoma. J. Neurooncol. 125, 75–78. https://doi.org/10.1007/s11060-015-1891-1 (2015).
Yilmaz, M. B. et al. Aromatase promoter I.f is regulated by estrogen receptor alpha (ESR1) in mouse hypothalamic neuronal cell lines. Biol. Reprod. 81, 956–965. https://doi.org/10.1095/biolreprod.109.077206 (2009).
Barh, D. et al. BARHL1 is downregulated in alzheimer’s disease and may regulate cognitive functions through ESR1 and multiple pathways. Genes 8, 245. https://doi.org/10.3390/genes8100245 (2017).
Khatpe, A. S., Adebayo, A. K., Herodotou, C. A., Kumar, B. & Nakshatri, H. Nexus between PI3K/AKT and estrogen receptor signaling in breast cancer. Cancers 13, 369. https://doi.org/10.3390/cancers13030369 (2021).
Li, F. et al. Estrogen hormone is an essential sex factor inhibiting inflammation and immune response in COVID-19. Preprint https://doi.org/10.21203/rs.3.rs-936900/v1 (2021).
Hopp, S. C. et al. The role of microglia in processing and spreading of bioactive tau seeds in Alzheimer’s disease. J. Neuroinflam. 15, 269. https://doi.org/10.1186/s12974-018-1309-z (2018).
Wang, D. et al. FGF21 alleviates neuroinflammation following ischemic stroke by modulating the temporal and spatial dynamics of microglia/macrophages. J. Neuroinflam. 17, 257. https://doi.org/10.1186/s12974-020-01921-2 (2020).
Dubourg, C. et al. Mutational spectrum in holoprosencephaly shows that FGF is a new major signaling pathway. Hum. Mutat. 37, 1329–1339. https://doi.org/10.1002/humu.23038 (2016).
Hyman, D. M. et al. Combined PIK3CA and FGFR inhibition with alpelisib and infigratinib in patients with PIK3CA-mutant solid tumors, with or without FGFR alterations. JCO Precis. Oncol. 3, 1–13. https://doi.org/10.1200/PO.19.00221 (2019).
Acknowledgements
We thank Department of Biotechnology (DBT), Ministry of Science and Technology, Government of India, under BINC (Bioinformatics National Certification) scheme [No.: BT/BI/10/078/2014] for research fund. We also thank Professor Pritha Mukhopadhyay, coordinator of CPEPA-UGC centre [“Centre for Electrophysiological and Neuro-imaging studies including Mathematical Modelling” (CPEPA) through “University Grants Commission” (UGC)], under the University of Calcutta, India for providing necessary research support in centre. We thank Mr. Ritayan Chakrabarti for his valuable comments on mathematical formulations.
Funding
This research was supported by the Department of Biotechnology (DBT), Ministry of Science and Technology, Government of India, under BINC (Bioinformatics National Certification) scheme [No.: BT/BI/10/078/2014] in the form of DBT-BINC Senior Research Fellowship grant to Mr. Suvojit Hazra (S.H.).
Author information
Authors and Affiliations
Contributions
S.H., N.C., B.T., A.G.C. conceptualized, investigated, validated and resourced the study. The methodology was designed by S.H., B.T., N.C. All the Bioinformatic, statistical, formal and software analysis related to research data were performed by S.H. S.H. wrote the original draft and N.C., B.T., A.G.C. reviewed and edited the draft and all authors gave consent to publish the data presented in the article. The project study was administered by both corresponding authors N.C., B.T. and supervised by lead corresponding author N.C.
Corresponding authors
Ethics declarations
Competing interests
The authors declare no competing interests.
Additional information
Publisher's note
Springer Nature remains neutral with regard to jurisdictional claims in published maps and institutional affiliations.
Supplementary Information
Rights and permissions
Open Access This article is licensed under a Creative Commons Attribution 4.0 International License, which permits use, sharing, adaptation, distribution and reproduction in any medium or format, as long as you give appropriate credit to the original author(s) and the source, provide a link to the Creative Commons licence, and indicate if changes were made. The images or other third party material in this article are included in the article's Creative Commons licence, unless indicated otherwise in a credit line to the material. If material is not included in the article's Creative Commons licence and your intended use is not permitted by statutory regulation or exceeds the permitted use, you will need to obtain permission directly from the copyright holder. To view a copy of this licence, visit http://creativecommons.org/licenses/by/4.0/.
About this article

Cite this article
Hazra, S., Chaudhuri, A.G., Tiwary, B.K. et al. Integrated network-based multiple computational analyses for identification of co-expressed candidate genes associated with neurological manifestations of COVID-19. Sci Rep 12, 17141 (2022). https://doi.org/10.1038/s41598-022-21109-3
Received:
Accepted:
Published:
DOI: https://doi.org/10.1038/s41598-022-21109-3
Comments
By submitting a comment you agree to abide by our Terms and Community Guidelines. If you find something abusive or that does not comply with our terms or guidelines please flag it as inappropriate.
